In my previous blog on Power Query (PQ), I had covered the fundamental tips for getting started with the tool. In this post on Power Query tips & tricks, we’ll delve into topics ranging from basic to advanced. With Power Query, you can perform data extract, transform, and load (ETL) processing. Using the PQ editor, you can connect to a wide range of data sources and apply hundreds of different data transformations by previewing data and selecting transformations from the UI. When you create a new transformation step, Power Query editor automatically creates the M code required to do the transformation, so you don’t need to write any code.
Currently, Power Query is available in online and offline mode. Online mode is for MS Power platform dataflows, Azure data factory wrangling dataflow, etc., providing experience through an online webpage. Offline mode is available in integration with Power BI Desktop and Excel.
Keyboard Shortcut to Launch PQ Editor
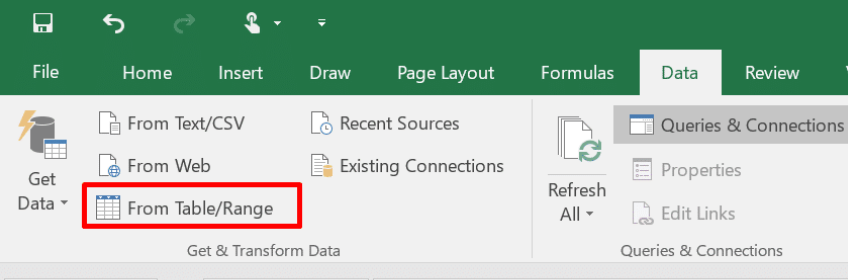
To open the power query editor, you need to go to the Data Tab and navigate to the Get & Transform > Get Data > Launch Power Query Editor.
You can be anywhere in your workbook and if you want to go to PQ editor, just press Alt+F12 to open the editor. If there are queries that already exist, you can view all of them. On the other hand, if your workbook is blank, pressing Alt+F12 opens an empty Power Query editor. Here you can go ahead and import your files using the New query option. To edit a query of a worksheet table that is the result of a query, simply press Alt+F12 which will open the query of the table directly in the PQ editor.
Quick Access Toolbar
Power Query tool has a Quick Access Toolbar (QAT) at the top left corner of the editor. You can move frequently used options from different places on the ribbon to the Quick Access Toolbar by right-clicking the option and selecting ‘Add to Quick Access Toolbar. This QAT can also be moved below the ribbon if it is getting lengthy. The worksheet table that is the result of a query can be provided a name that is visible all the time on excel. For this, you need to go to the table, navigate to Table Design > Table Name and right click to select the option “Add to Quick Access Toolbar”. This will always display the table name, either in the QAT area at the top left or below the ribbon.
M language syntax
The M language is the data transformation language of Power Query. If you find that the user interface functions and transformations can’t perform the exact changes you need, use the advanced editor and the M language to fine-tune your functions and transformations. Anyone starting with a new language will be unsure of the syntax of the language. In PQ editor, navigate to the function(fx) area to enter the Power Query M function (Let us consider List.Count as an example). The actual syntax of this function is List.Count(list as list). Just entering the “= List.Count” and pressing the enter button will provide the function details along with the syntax on the PQ editor.
Add a list on each row
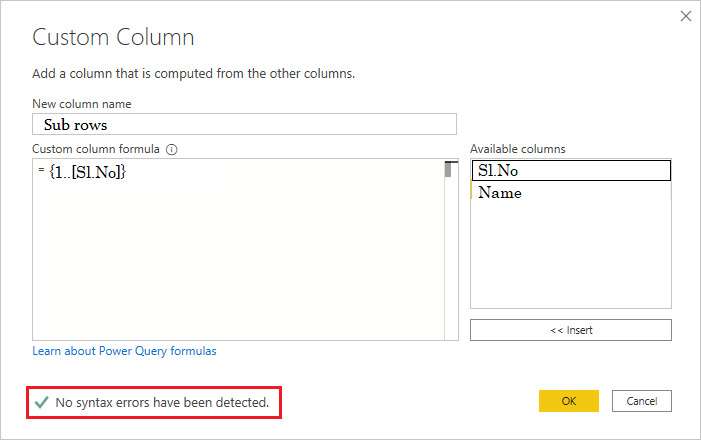
To generate a fixed or variable number of rows for each existing row in Power Query, navigate to the Custom Column option under Add Column tab as shown in the figure below.

Once the Customer Column pop up appears on the screen, enter the new column name (Sub rows) followed by the formula under the Custom column formula section. Entering {1..10} here will generate 10 rows for each row. However, if you want the row count to be dependent on the value of some other row (Example: Sl.No column), enter the formula as shown below. You can also check whether the syntax is correct or not by the message below the formula section.
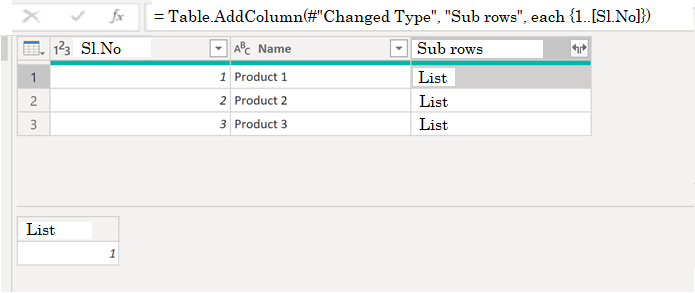
Once you click OK, the new table will be as shown below. The List will vary based on the row count mentioned in the column Sl.No.
Comparing two tables
We have come across tools like Notepad++, Winmerge, MS Word etc to compare the contents of two text files. However, if you are comparing tables, Power Query provides some very useful features that we will be looking into here. The steps to compare two tables will be as follows:
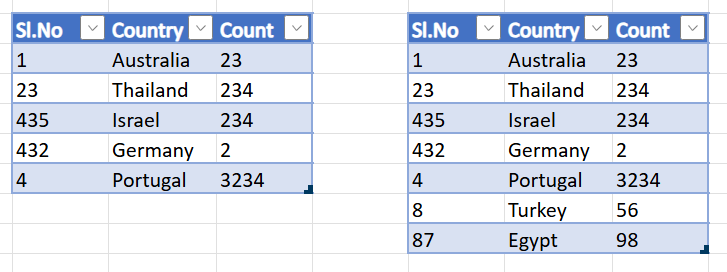
- Keep the two tables to be compared ready. Table1 being the right one and Table2 being the left one.
- Select any of the table and navigate to Data tab to select “From Table/Range”.
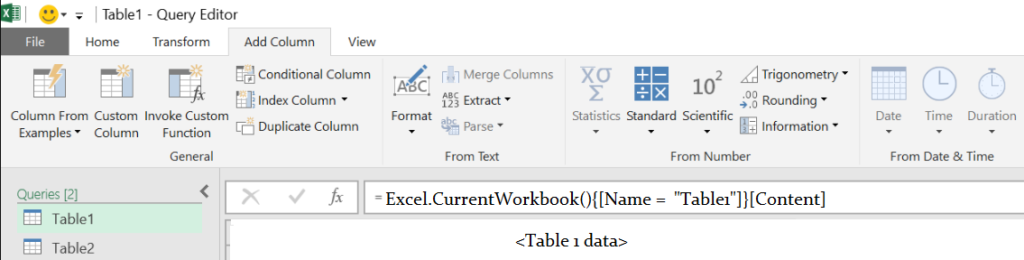
- Now you will be in the PQ editor. If you have opened the PQ editor from Table1, duplicate the query, rename it as Table2 (Select Source under applied steps) and edit the M code data name section as Table2. This will populate the Table2 data automatically under the Table2 query section.
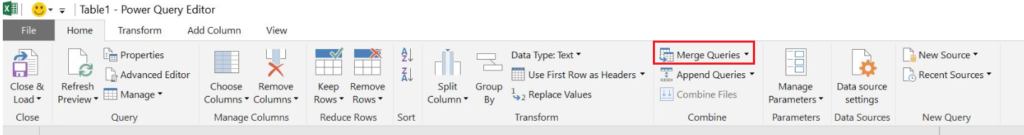
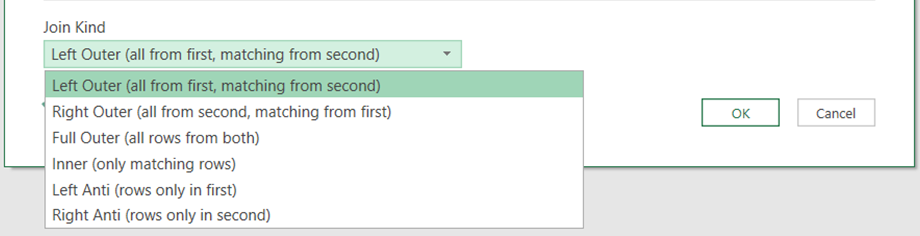
- To compare the two tables, select the down arrow next to the Merge Queries. From the available options, click on the Merge Queries as New option.
- The Merge dialog box appears. The Table1 data appears at the top, while you can select Table2 from the drop-down below to display its data.
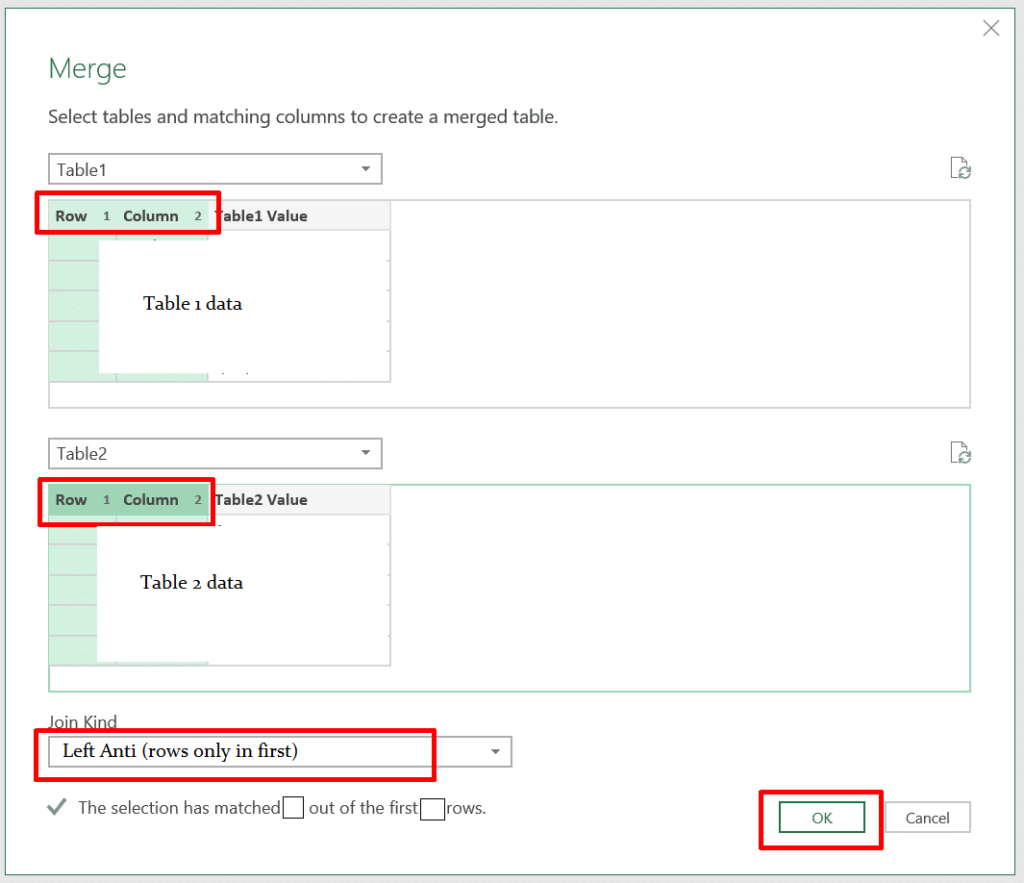
- Of the various Join Kind shown below, let us go with “Left Anti (rows only in first)” option. Select the first column in both the Table1 and Table2 and click on OK button. The lower section in the above figure displays the number of matched rows.
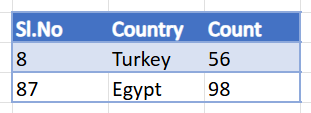
- Considering the tables as shown in the step1, the result of the above comparison would be as follows. The remaining rows in Table1 will be displayed separately as the query result.
These are a few of the Power Query tips & tricks that you might have found useful. In the future blogs, i will provide more tips & tricks on the topic.
Further Reading:


Leave a Reply