Tag Data Analysis
Predictive analytics helps us understand potential future occurrences by analysing historical data. Machine learning (ML), on the other hand, is a subset of artificial intelligence (AI) that enables machines to learn from large datasets and identify patterns without being explicitly… Continue Reading →
As mentioned in my earlier blogs, Microsoft Power BI is an interactive data visualization software product developed by Microsoft with primary focus on business intelligence. In this next post in the series on Power BI, i have tried to delve… Continue Reading →

A good dashboard is simple and avoids information overload. It features clear formatting, descriptive titles, and is dynamic, easy to maintain, and straightforward to update. Before creating a dashboard, several factors must be considered, the most important being the needs… Continue Reading →

Agile or agility is the term used to characterise flexibility and short cycle times. The Agile Manifesto serves as a roadmap for achieving flexibility and short cycle times. Scrum is one of the popular ways of implementing agile. It is… Continue Reading →

Power query is available in both MS Excel and Power BI. In MS Excel, this feature is primarily used for data cleaning and preparation (note that data size limitations exist) before loading the data into an Excel spreadsheet for analysis… Continue Reading →

To make a data-driven decision, finding the most important data and formatting it in a way that’s easy to understand is the key. One of the easiest ways to make data easy to understand for technical and non-technical audiences is… Continue Reading →
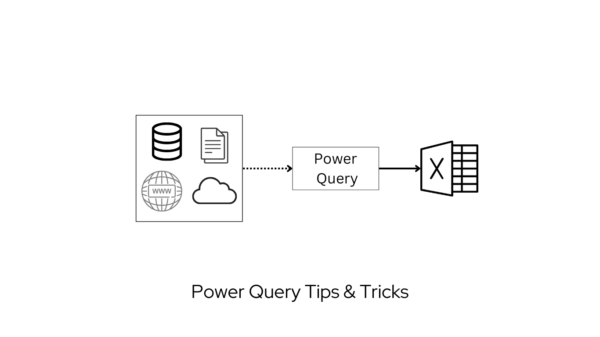
In my previous blog on Power Query (PQ), I had covered the fundamental tips for getting started with the tool. In this post on Power Query tips & tricks, we’ll delve into topics ranging from basic to advanced. With Power… Continue Reading →

Microsoft Power BI is a business intelligence (BI) platform that provides users with tools for aggregating, analyzing, visualizing and sharing data. Power BI’s user interface is fairly intuitive for users familiar with Excel and Power query, and its deep integration… Continue Reading →

Power Query is a data automation tool. It can be used to perform ETL tasks like importing data from external sources, common tasks on the imported data like cleanse & prepare data, stack or merge data sets, group & summarize… Continue Reading →

Microsoft Forms can be used to create surveys, quizzes, polls and questionnaires. These features can be used at organizations to survey employees or customers on any topic, gather feedback on training and coaching, ask for advice on projects and key… Continue Reading →