
I was using MS Excel to keep track of my expenses and was thinking about using Excel VBA to automate the entry. But when i came across the Google AppSheet platform i had no more thoughts about automating with Excel VBA. AppSheet is a no-code platform that allows users familiar with basic spreadsheet and database operations to build apps easily. The AppSheet platform allows users to create Android, iOS compatible mobile apps and web apps using data sources like Google Drive, OneDrive, DropBox, Office 365, and other cloud-based spreadsheet and database platforms. In this article i will be detailing about the features of the free plan of AppSheet that can be used by anyone free of cost. You can stay on the Free plan forever if your apps are for personal (non-business) use and you are the only app user.
Getting Started
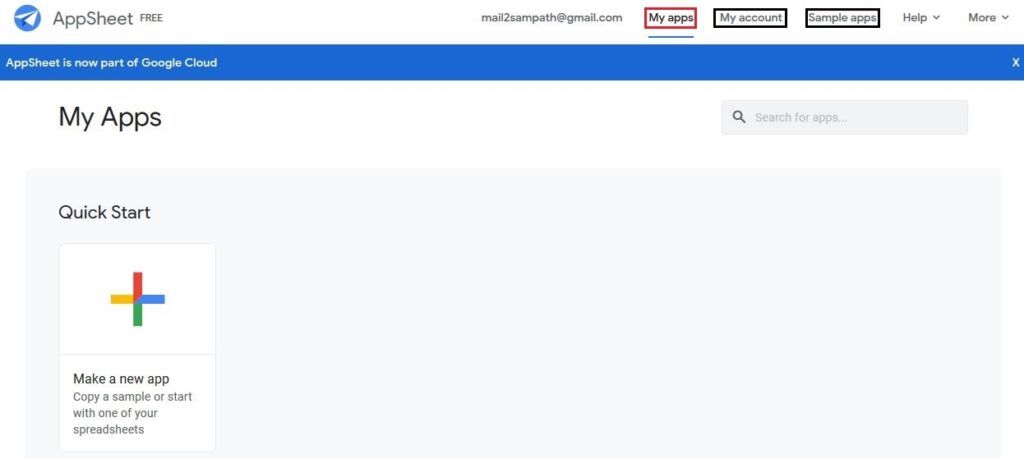
Click the link to login to the AppSheet platform using your google account login credentials. Once you login you can see various tabs, but the tabs that might be useful to a beginner or a regular user are How to create an app, Platform, Sample apps and My account. How to create an app provides a step by step guide on how to get started with creating app using your existing data. This will be helpful to the beginners those who want to get started with AppSheet quickly. The Platform tab is where the actual action happens ,i.e, you can get started by clicking on “Start for free” that will open the My Apps screen shown below wherein you can create a new app by clicking on the “Make a new app” button. Here, you can also see the already created apps if any.
The Sample apps tab provides a list of pre-built sample apps that can be customized as per customer needs. The list contains apps like the Project Tracker, To Do List, Facility Assets, Events Calendar, Timesheet Tracker, Simple Survey, Client Expenses etc. The My account tab displays what is the plan that you are subscribed to. Security setting, policy setting to the app can be done here but is available only to the customers using the paid services.
An Example App
Out of my own experience i can say that the best way to learn any new topic is to gain practical knowledge on the topic. In accordance with that, let us start by creating a simple App to track the everyday personal expenses.
Prepare and Connect your data
Open the spreadsheet or database you would like to use for your app. As new users using the free version, we can get to see only the Google spreadsheet option available. Later on i will explain how to change the settings in-order to use other sources of data. To make sure AppSheet can read your data appropriately, set up your data with column headers in the first row, and rows of data underneath if any. In case data is present, see to it that each column contains a single type of data like a single column with date/number/text only etc.
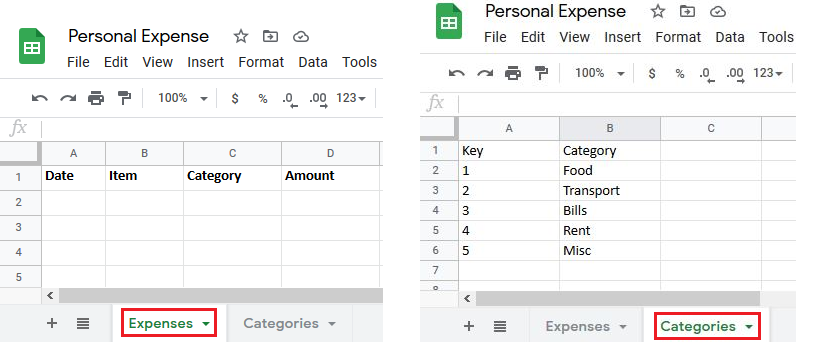
In this example as it is a personal expense tracker, we will use the column headers as above. Since the Category column is fixed we will use the drop-down option. The same is listed in the Categories sheet with a unique identifier for each row. Once your spreadsheet is ready, you need to connect it to AppSheet in any of the following ways.
- In case of Google Sheets, you can connect your data to AppSheet directly from your Sheet by clicking on Tools >AppSheet >Create an app.
- You can always connect to a new database/spreadsheet by going to your My Apps page on AppSheet and clicking on “Make a new app”.
Define how your connected data will be used
Each spreadsheet consists of one or more worksheets, any of which may be used to store data for a corresponding data table within the app. Let us get started by clicking on “Make a new app” under the My apps tab. This will guide us through the following windows wherein we need to select the earlier created Google spreadsheet “Personal Expense” that has 2 worksheets.
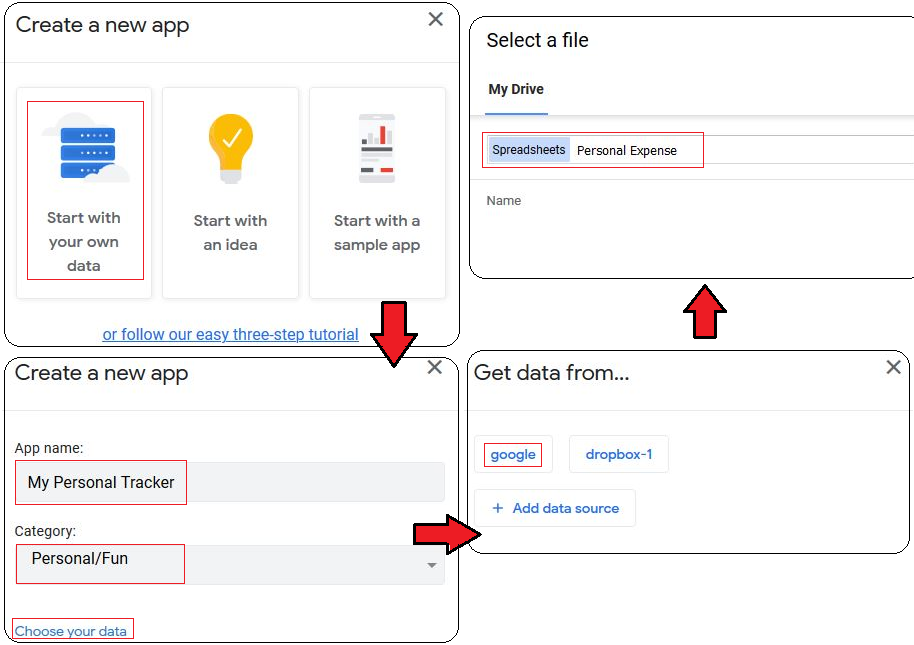
Once the spreadsheet is selected, AppSheet automatically creates an app with default settings as follows. When creating a new app from a spreadsheet, AppSheet will automatically create a data table connected to the first worksheet in the spreadsheet. As you can see below, the Expenses data table was automatically created for the first worksheet.
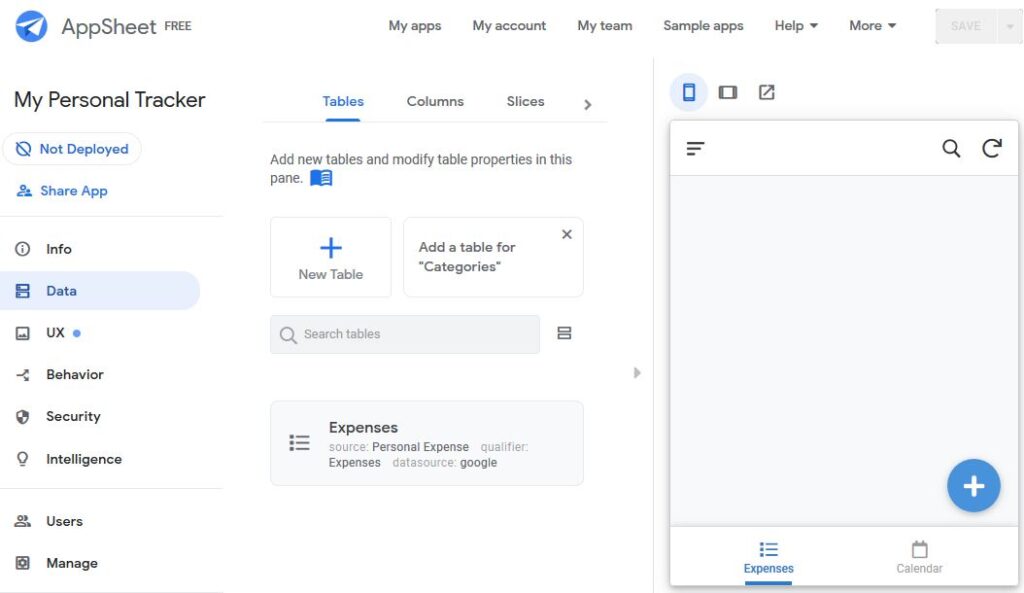
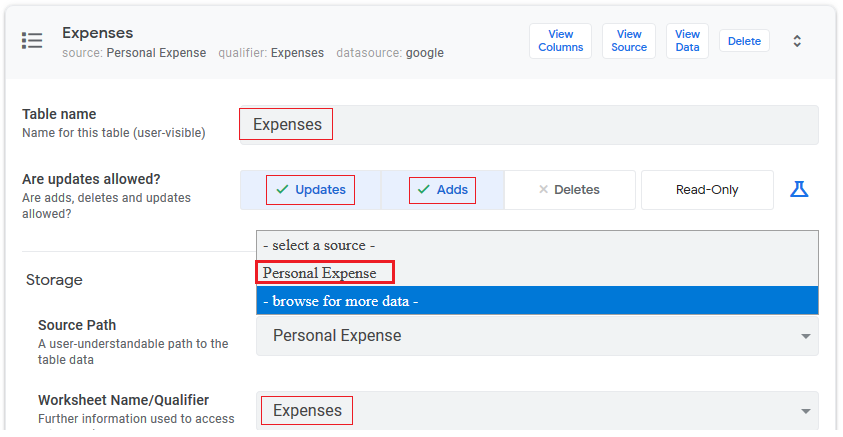
The app’s data tables are visible in the app editor in the Data >> Tables tab. An app may use one worksheet, multiple worksheets within a single spreadsheet. To add a new data table and connect it to a worksheet, in the app editor, go to the Data >> Tables tab and click on any shortcut to potential tables detected by app editor or use the “New Table” feature to add manually. Here you can create additional data table by clicking on the shortcut Add a table for “Categories” as detected by app editor. The detailed setting like the Table name, Source Path, Worksheet Name of the Categories data table should be set appropriately. Since you will be using this table for the drop-down option only, see to it that you select only the Read-Only option for enabling the necessary updates.

Now let us look at the first worksheet table Expenses created automatically. Cross check the contents and make necessary changes if any. The items to check are marked in red boxes below. The Deletes option has been deactivated for updates allowed in order to avoid any accidental deletion of data. In the “Prepare and Connect you data” section earlier i had mentioned that i will teach you how to connect to other sources of data. Use the “browse for more data” option under Source Path to select other sources of data other than google sheets .
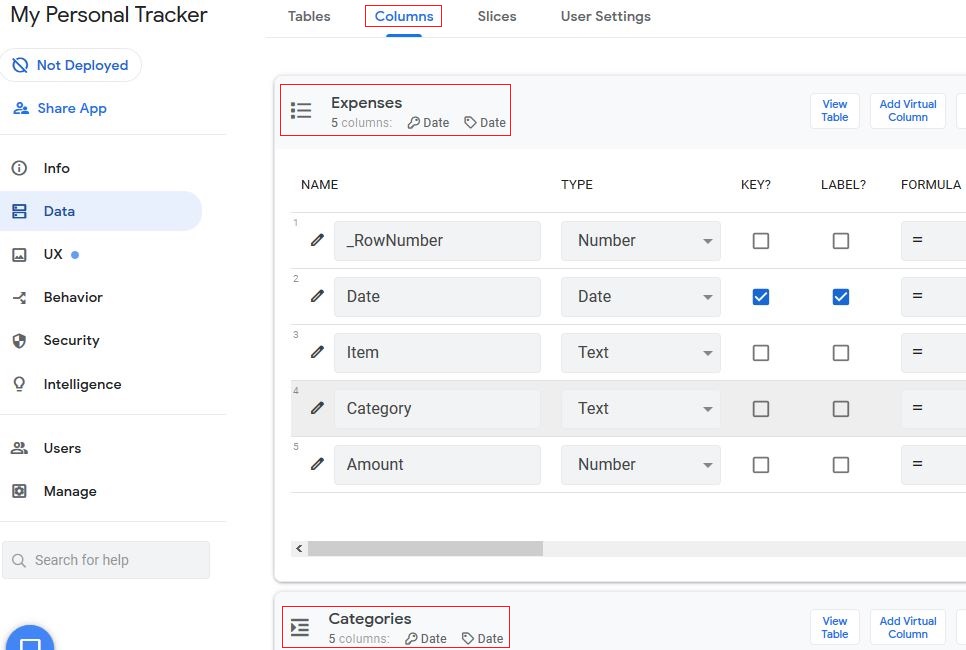
In order to configure the column definition of each table, navigate to Data >> Columns tab and make sure that AppSheet is interpreting each column data properly. The default setting of the Expenses data table is as shown below.
As the above settings were default, there were a lot of changes that needed to be done in order to fit in to our application requirements. The final settings of Expense data table column will appear as follows. The major change points being column “Date” LABEL tick mark was removed and column “Item” was tick marked for LABEL. KEY refers to unique row identifier, whereas LABEL may or may not be unique. The “Date” column INITIAL VALUE section was input with the formula to display the entry date and time that would be unique for every entry. The “Amount” column was of TYPE number that is changed to decimal as expenses could be in decimal as well.
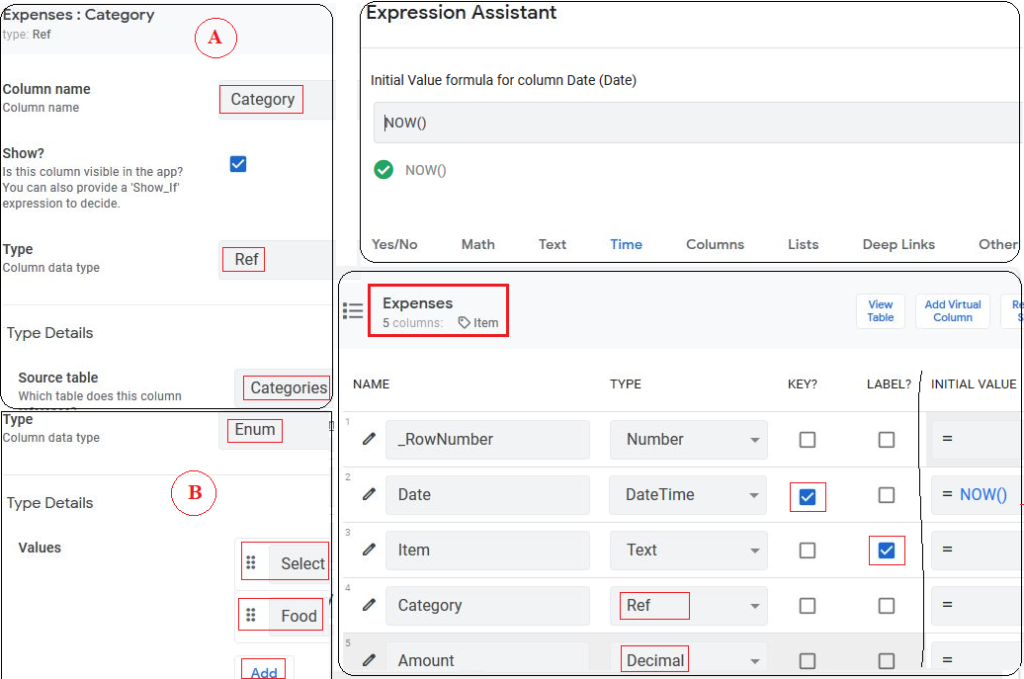
Lastly, we will be using drop down option for the “Category” column. This can be accomplished in 2 ways, one is by selecting the type Ref and following the steps (A) or by selecting type Enum and following the steps (B).
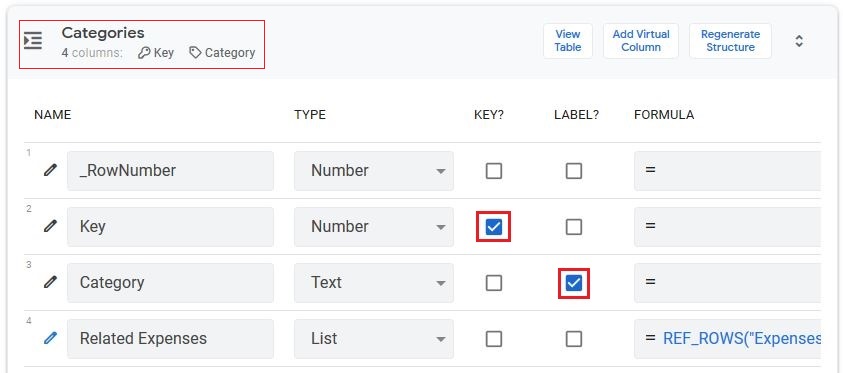
Now we are left with one final step, i.e, to configure the columns of Categories data table. The final setting of the Categories data table would be as follows. The changes done here are tick marking only the KEY check box for the Key column and LABEL check box for the Category column.
Create and Customize Views
To create a view, go to the UX tab (UX stands for user experience), click on the Views section and select “New View”. But as we already have an existing view ,i.e, the “Expenses” view that was automatically created by the app, there is no need to create a new one. The UX >> Views tab, “Expenses” view can be directly accessed from Data >> Tables tab by clicking on View: Expenses link present below the App display as shown in the below picture.
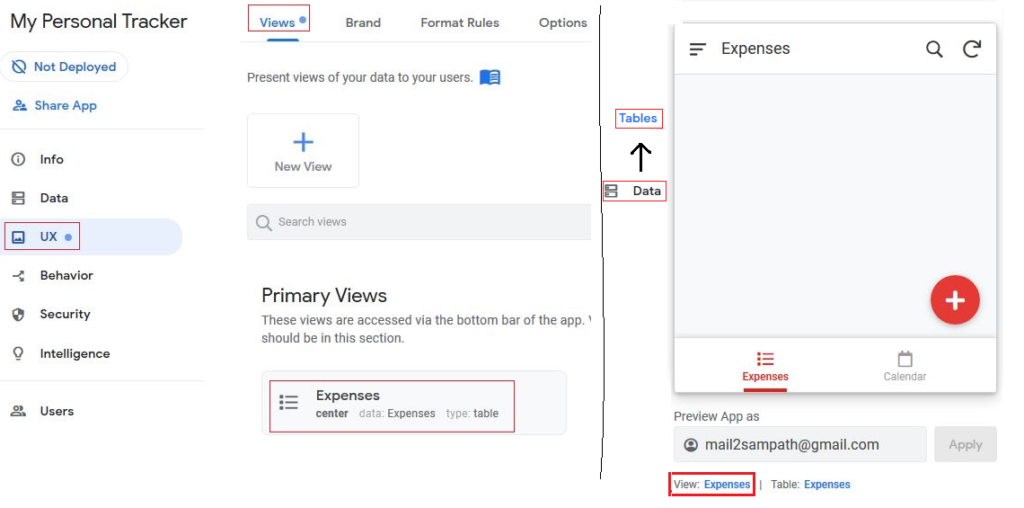
Now that you have moved to the “Expenses” view, it would better to give an overview of the necessary settings before making an entry in the app.
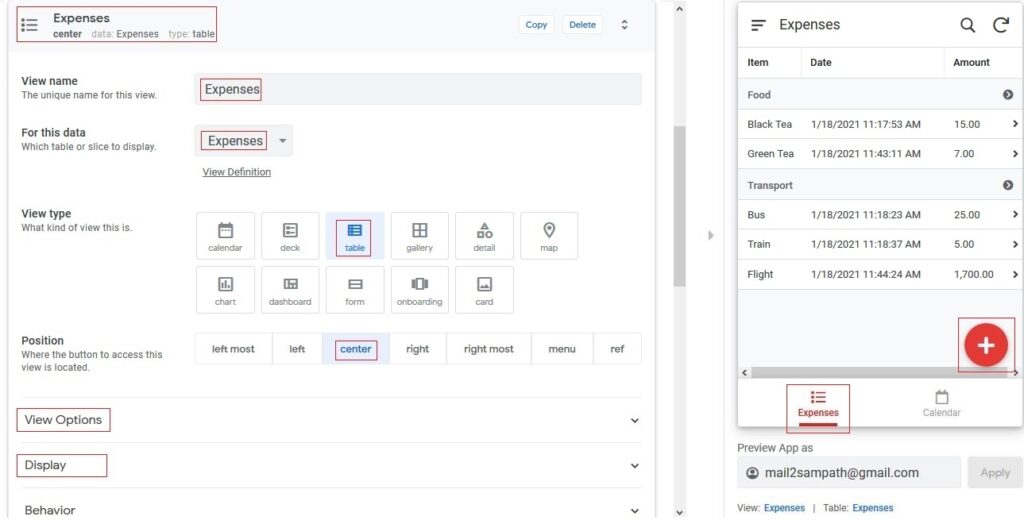
- The View name is set to “Expenses” for the “Expenses” data. In case you need to change the view name or data you can do so by making the necessary entry or by selecting the appropriate data.
- Choose which View type you want. Play around with each view to see which one works best. In our example the table view looks good.
- Choose how the view can be accessed by setting its Position ,i.e, along the main menu at the bottom of your app or via the reference menu in the top left corner of your app.
- The View Options area, can be used to specify which row goes where.
- The Display area, can be used to choose the Display View Name and Icon for your view that is currently set to the one marked in red square.
Just click on the plus icon at the bottom right of the app that has been highlighted with the red square in the above picture. You will be prompted to make an entry for Item, Category and Amount. In the picture above you can see completed entries for five items.
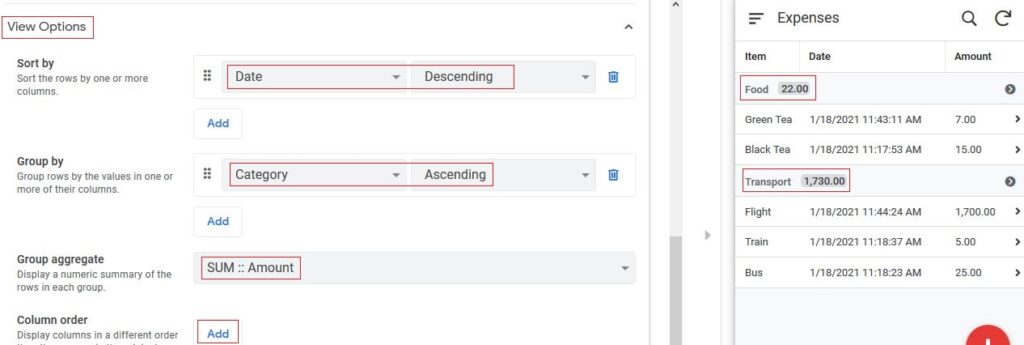
The below picture shows an expanded view of the View Options area. The Sort by was set to ascending order in the above picture that has been changed to descending to display the latest data at the top. The Group by is unchanged ,i.e, it is still in the ascending order. You can see a new section marked in red frame in the app GUI , this was added by setting the Group aggregate to SUM Amount. The Column order can also be changed by clicking on Add and selecting the appropriate column.
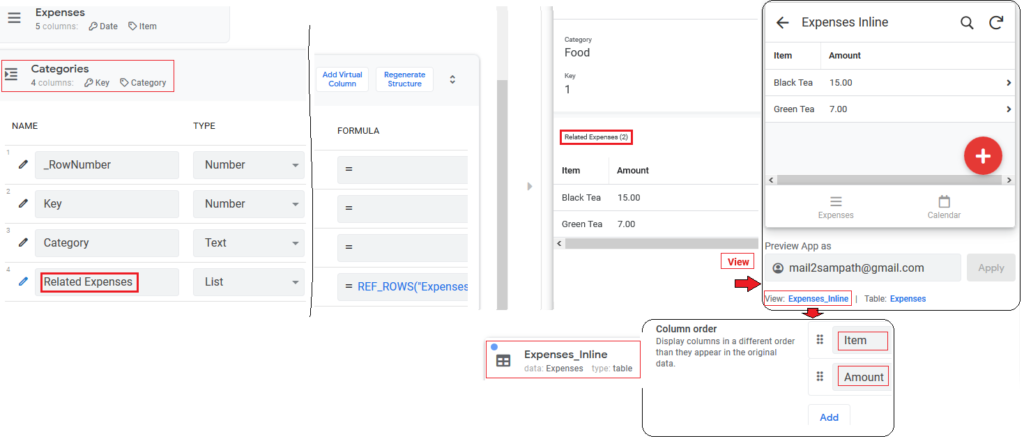
When you click on either the Food/Transport group item in the app GUI, you will be directed to the “Related Expenses” list as shown below. This is a virtual list that is not part of the source data and is created when two sheets are linked together. Clicking on View will take you to the “Expenses Inline” view wherein you need to click on the View: Expenses_Inline link that will take you to the UX >> Views tab, “Expenses_Inline” view settings under the system views. Here, you can add/delete, set the order of the columns of the list that you want to display.
To customize your app’s look and feel, go to UX >> Brand and UX >> Format Rules , where you can specify your theme, colors, logos, and much more.
Create Custom Buttons, Actions and Automations
The Behavior tab in the AppSheet editor lets you set up custom buttons and actions that can be used in a wide range of ways. These can be set by going to Behavior >Actions >New Action. From there you can set the Action Name, specify the type of action to occur, and, if you want that action to be triggered by a button, you can specify the button’s Look and Feel.
Behavior >> Workflows and Behavior >> Reports lets you set up automations, such as emails or texts being sent, data being added or updated, or new calendar events being added. Workflows and Reports are very similar, with one key difference: Workflows are automations that are triggered when certain actions occur like a status change from pending to completed. However, Reports are automations that are triggered based on periodic schedules.
Finally, if you want to be able to use your app when its not connected to the internet, you can enable offline use in the Behavior >> Offline/Sync section.
Share and Deploy your App with Users
Whenever you’re ready, you can easily share your app with others. Since you are using a free plan with the app prototyping option only, you can share your app with a maximum of 10 users. Go to the Users tab, and in the Users section type the email addresses of the people you want to share your app with. Once you verify you’re human, you can customize the email message they will receive from AppSheet, inviting them to use your app. From there, they can either download the AppSheet app on their mobile or tablet device, or open your app in a web browser.
Finally, once you’ve finished making changes to you app, you can officially deploy it, which will activate all the services in your app. However, this is applicable, when you want to use your app in a non-prototype setting ,i.e, for the paid plans. Go to Manage>Deploy>Deployment Check and click “Run Deployment Check.” AppSheet will analyze your app to make sure it’s working properly and give you a full report. If you’re ready for it to be deployed, select “Move app to deployed state.” to go live.
More Features
Now that we are done with our prototype App, let us take a look at some of the features that we might have missed. The first feature is the one under Info >> Spec tab that shows the data relationships between the various tables.
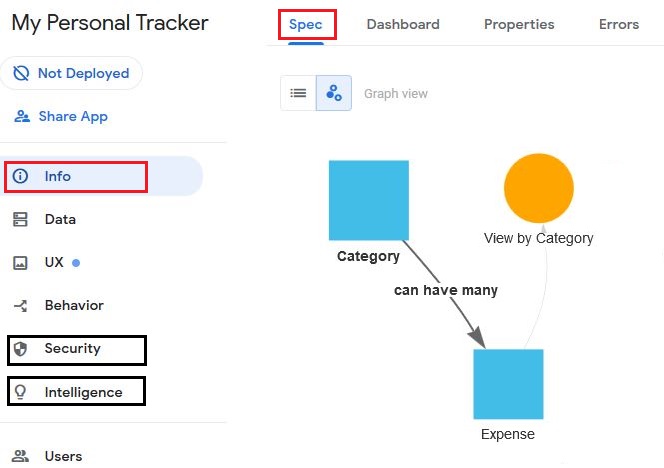
The data relationship diagram above tells us that, a Category can have multiple Expense items. Currently, the Expense view option is set to Group by Category. This gives us an overall picture of the data relationships and helps to better understand the App structure.
In Security, you can set up user roles and define security features. However, most of the features are available under the paid plans only. One other feature ,i.e, Intelligence lets you incorporate machine learning into your app, such as sentiment analysis, predictive analytics, and optical character recognition. Even here, almost all of the features are available under paid plans only.
Finally, you can go to the AppSheet Help Center to access hundreds of help articles on various AppSheet features.
Further Reading :


Leave a Reply