To make a data-driven decision, finding the most important data and formatting it in a way that’s easy to understand is the key. One of the easiest ways to make data easy to understand for technical and non-technical audiences is to create a dashboard that easily displays all of your data visualizations in one place. In Jira, dashboards are designed to display gadgets that help you organize your projects, assignments, and achievements in the form of charts, tables or diagrams. They show various types of real-time information to help you track and monitor work across projects. In this blog, “Jira Data Visualization: A Guide to Effective Dashboards”, you will go through the step-by-step procedure on how to create an effective dashboard.
Once you’ve created a Jira dashboard, you don’t have to do anything else. Every time you reload the dashboard, all the reports will update automatically with the latest data. You can also configure them to refresh at regular intervals. This makes dashboard reporting a much faster way of reporting. In this blog post, I will pick a few gadgets that is natively available in Jira. While these gadgets are really easy to use, they’re limited in what data they display, and in how they display it. Using an add-on is recommended if you want to make use of more features.
Creating a New Jira Dashboard
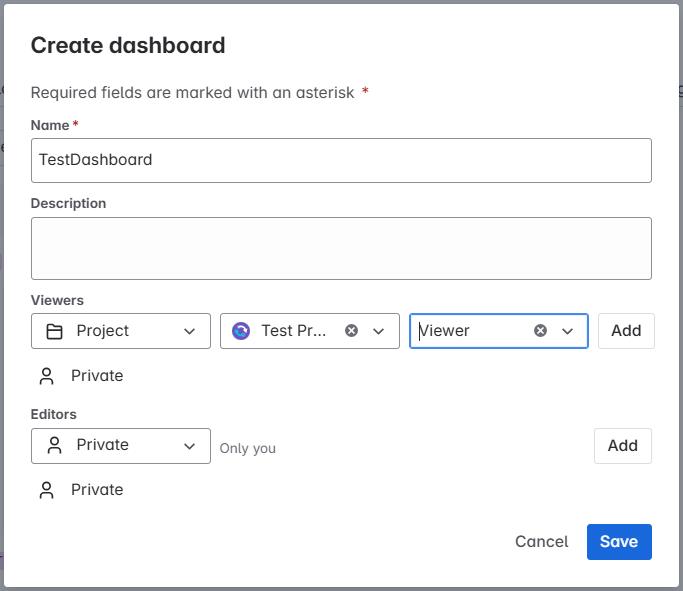
Navigate to Dashboards > View all dashboards and click on Create dashboard, or the option of directly navigating to Dashboards > Create dashboard is also there. This will open the following window. You can specify the Dashboard Name(TestDashboard), Description and set the Viewers, Editors permissions as well.
The next screen,i.e, the following one will appear once you click on the save button in the above window.
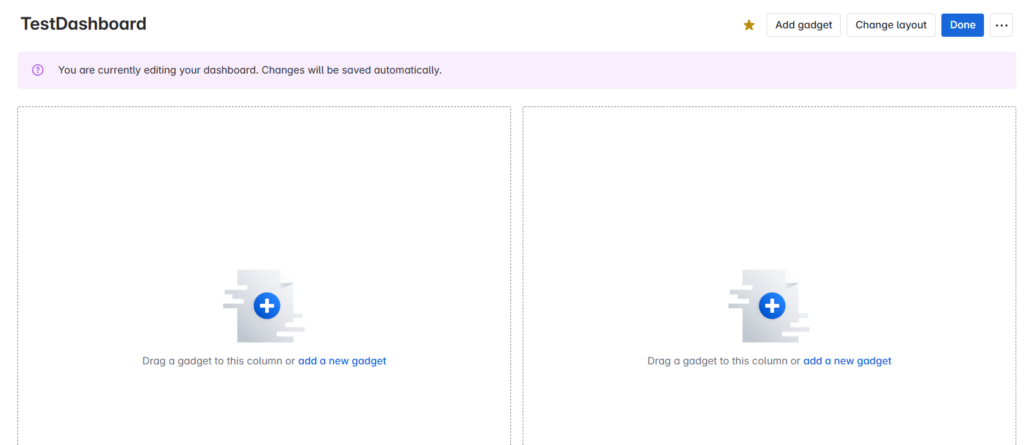
Once you are in this screen, you will have to plan the layout based on the target audience. An appropriate layout can be selected by clicking on the “Change layout” button at the top right. Let us use a pie chart to display the status of the sub-tasks, a table to display the volume of work handled by each assignee, a list that displays each of the work summary and a section that describes the contents of the complete dashboard.
Adding the Gadgets: Gadget 1
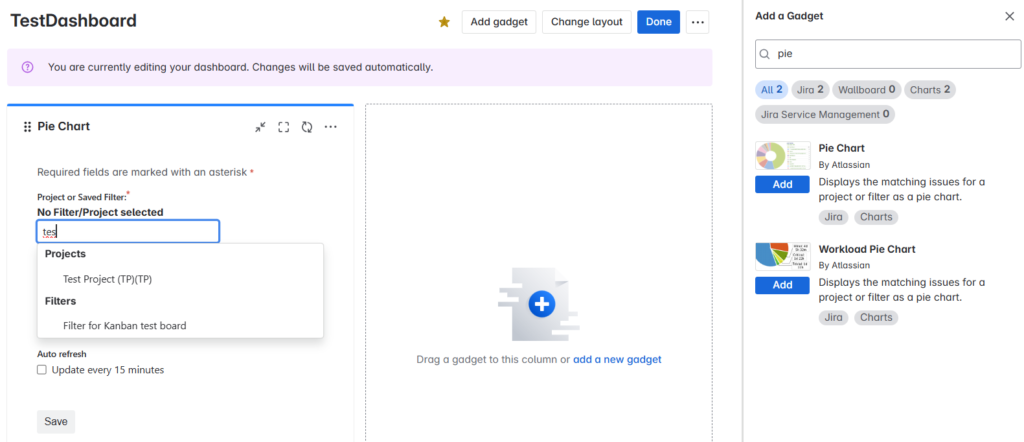
Now, let us start with the pie chart preparation. For this, you need to click on the “Add gadget” button at the top right and search for the pie chart gadget as shown below. Click on the Add button to add the gadget to the layout.
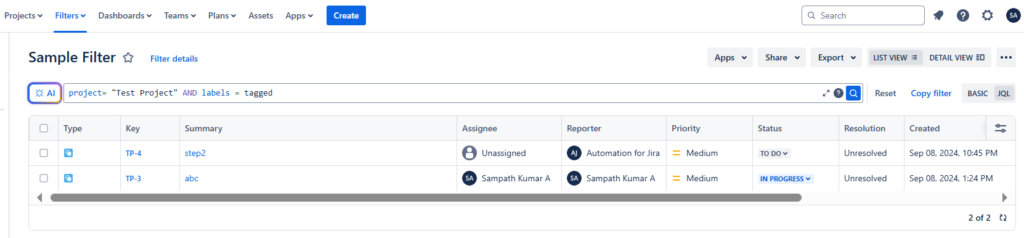
In the gadget, you need to add the project/filter information. For this, you need to first create a filter that can be used in the gadget. The filter “Sample Filter” is as shown in the figure below.
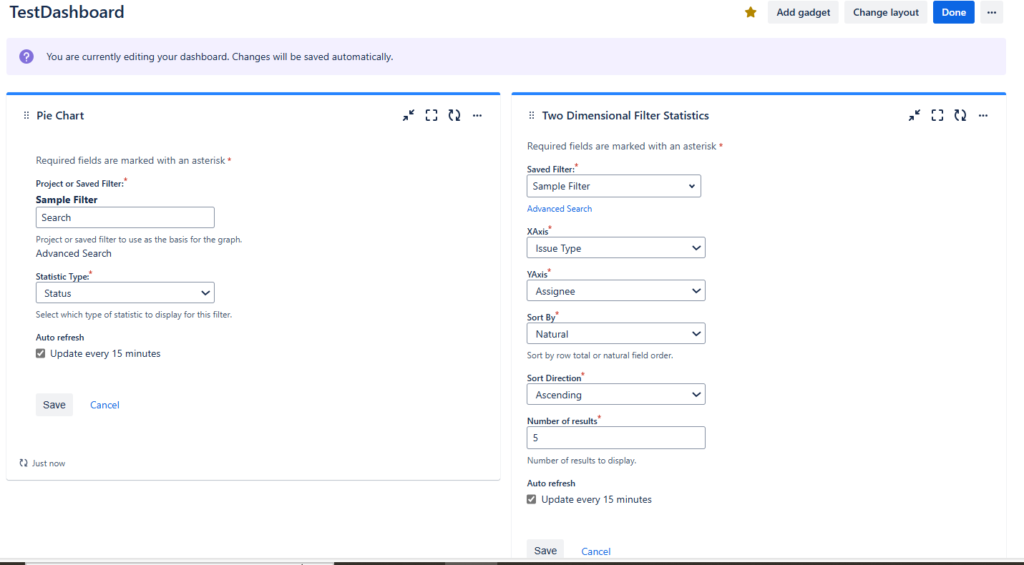
Once the filter, “Sample Filter” is ready, you can add it to the gadgets for display on dashboard. Now, our pie chart gadget, will look as follows once the filter “Sample Filter” is added.
Adding the Gadgets: Gadget 2
Additionally, one more gadget (Two Dimensional Filter Statistics) is added to display the volume of work handled by each assignee and can be seen in the below picture.
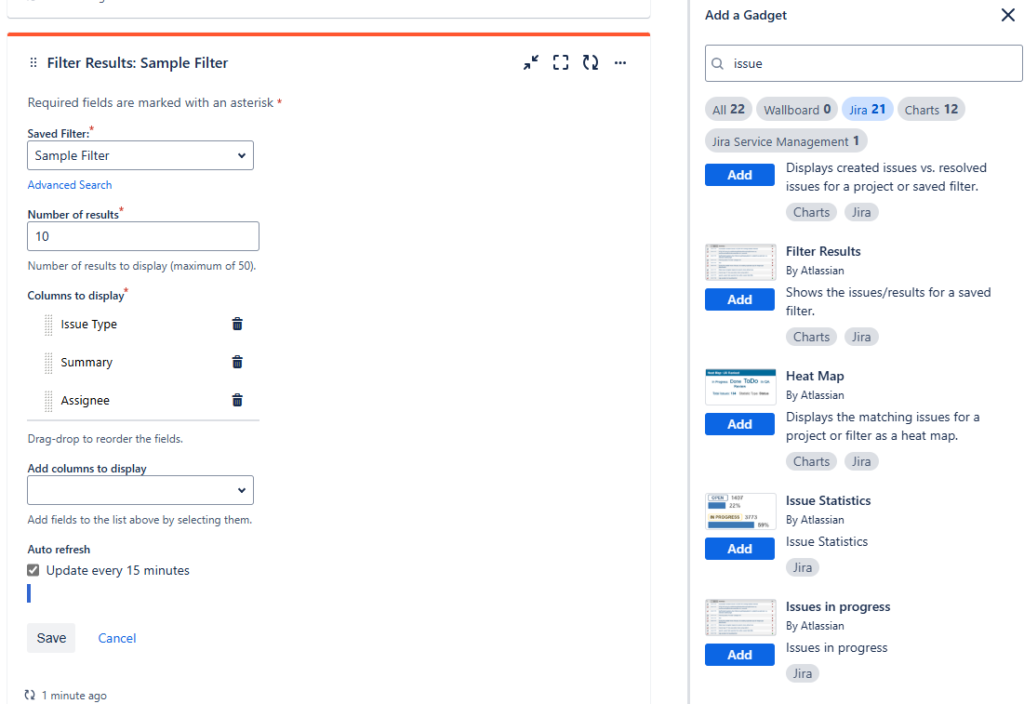
Adding the Gadgets: Gadget 3
One more gadget (Filter Results) is added to display the details of work handled by each assignee. Refer to the following picture for the settings to be done on the gadget. Once done, click on the Save button.
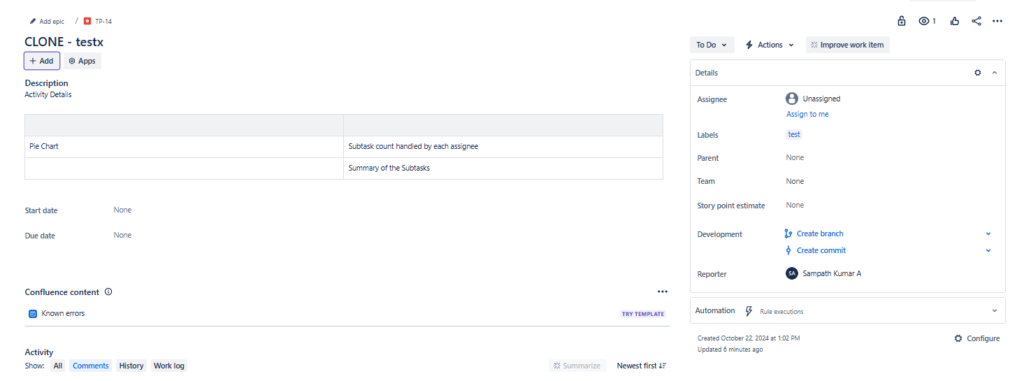
Adding the Gadgets: Gadget 4
Our final section will be a gadget that will be used to describe the contents of the complete dashboard. To do this, you first need to create a ticket (issue type bug is used) and add a description table, as shown below.
The next step would be to create a filter “test filter” to filter out the above bug issue type ticket. The JQL used to filter out the above ticket with label as “test” is as follows.
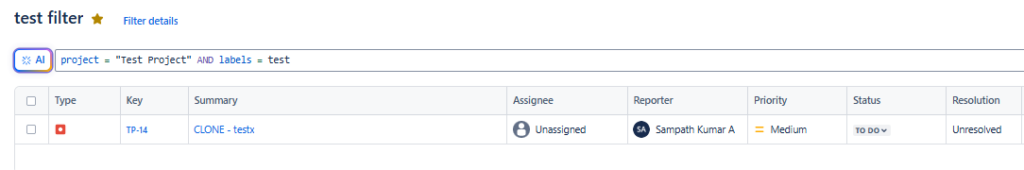
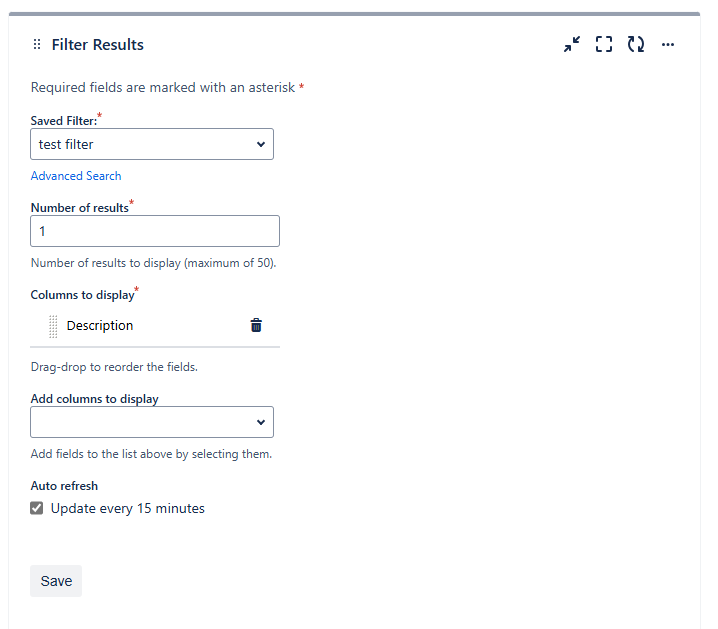
This filter will then be used in a separate gadget (Filter Results) to display the description contents of the above bug type ticket. This is done by making the below settings.
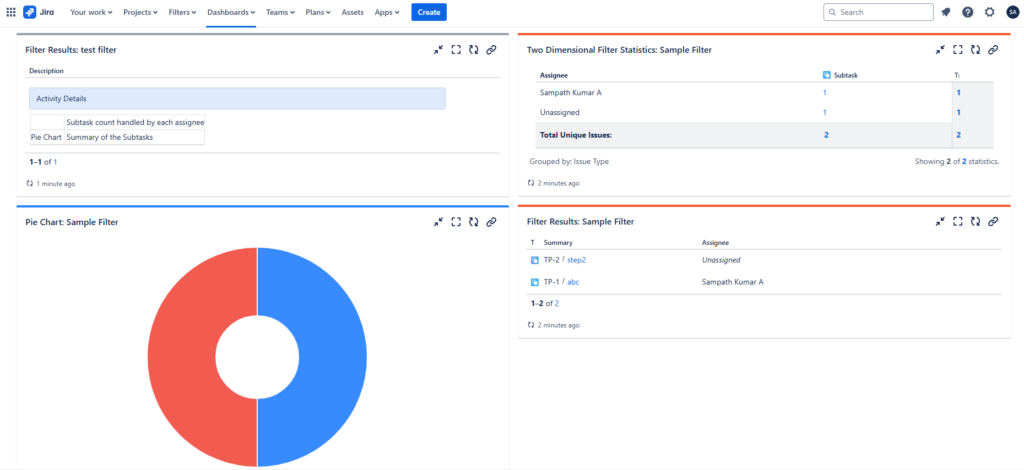
The Final Dashboard
Based on the settings done till now, our final dashboard will appear as follows. If you are sharing the dashboard with others in your team, see to it that the above filters used, have the necessary Viewers/Editors permissions set before sharing.
Further Reading :


Leave a Reply