Excel can handle substantial amounts of data but python has an even greater capacity to manipulate large amounts of data. Since VBA is integrated into Excel, you have the advantage of using Excel as a GUI. It is also really easy to automate simple things in Excel and pretty easy to create a user interface if you’re trying to build a tool for someone else to use. However, python would be the best choice if you want to do anything that requires matrix manipulation, advanced statistical analysis, data visualization and presentation as it has some really powerful tools.
Python is an increasingly popular tool for data analysis. In recent years, a number of python libraries have reached maturity, allowing other language(R, SAS etc.,) users to take advantage of the beauty, flexibility, and performance of Python without sacrificing the functionality the older programs have accumulated over the years. Also, Python is Open Source – free to install, has awesome online community and very easy to learn.
Though many excellent Python books and online courses are available, I wouldn’t recommend many as they are intended for a general audience rather than for some one who wants to do data analysis alone. The way i started with python was as a general audience, did a general online course on python introduction to get familiar with the language but the real confidence that i can do something on my own with the gained knowledge rarely cropped up. Later on did one more online course on introduction to python for data science, but due to lack of depth did very little to improve my confidence level. I also purchased a book “Introduction to Computing and Problem solving with Python”, but due to the generalized content kept it aside to use it as a reference.
Finally, i worked on a few projects on data analysis using python which was part of the course provided by DELFT university that really boosted up my confidence. My view on learning a new language is rather than going through a lot of reading materials, the best way is to start with a project, go through challenges thrown at you by the project, learn a lot, emerge out successful, gain the confidence. This really helped me and am sure will help anyone who follows the flow.
Installation
Rather than installing the python software and the libraries one by one which is a cumbersome process, it is best to install the Anaconda software which comes as a package consisting of the python and preinstalled libraries like the pandas, numpy, openpyxl, networkx etc. Let me take you through the step by step installation of both the python 3 and anaconda software on windows.
Python 3
Installing does not involve much more than downloading the Python installer from the python.org website and running it. Let’s take a look at how to install Python 3 now:
- Open a browser window and navigate to the Download page for Windows at python.org.
- Click on the link for the Latest Python 3 Release – Python 3.x.x.
- Scroll to the bottom and select either Windows x86-64 executable installer for 64-bit or Windows x86 executable installer for 32-bit.
- Once you have chosen and downloaded an installer, simply run it by double-clicking on the downloaded file.
- A dialog window pops up and make sure to tick the box “Add Python x.x to PATH” to simplify the command line execution before clicking on Install now. PATH is an environment variable in Windows. It basically tells the command line what folders to look in when attempting to find a file.
python python_script.py
Here the command line will look through all the PATH folders for python and find it in the folder that the Python installer has added there. In case the “Add Python x.x to PATH” is not ticked we need to specify the whole path to execute the file.
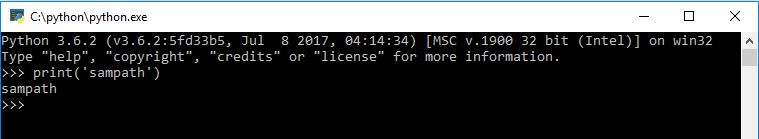
Once python is installed, we can open the python shell to confirm the version(3.6.2) installed. Now we have installed the Python Interpreter ,i.e, a program which translates your code into machine language and then executes it line by line.We can use Python Interpreter in two modes:
In Interactive Mode, Python interpreter waits for you to enter command. When you type the command, Python interpreter goes ahead and executes the command, then it waits again for your next command. The below picture is an example of interactive mode.
In Script mode, Python Interpreter runs a program from the source file.To create programs you can use any text editor, just make sure to save your file as plain text with “.py” extension.To execute the program, open terminal or command prompt, navigate to the source file directory and type the command “python sourcefile.py” to execute the particular file.
We also need to use command line to install any new package library for python using the command “pip install libraryname“, provided the PC is connected to internet.
Anaconda
I think the Anaconda distribution of Python is the the best option for anyone who wants to start with Python, given the ease of installation and usage.
- Open a browser window and navigate to the Download page for Windows at anaconda.com.
- Click on the link to download the latest Python 3.x version.
- The download file is quite large(over 500MB) & the installation also takes more than 2GB of disk space.
- Select all the necessary options to complete the installation.
When you download and install the Anaconda distribution of Python, you are getting several tools related to Python development. One of the tools is Spyder, an IDE useful for writing, running, and debugging code.To start the IDE, first click on the ‘Anaconda Navigator’ icon from the start menu. Later, click the blue “Launch” button below the “spyder” icon to launch Spyder.
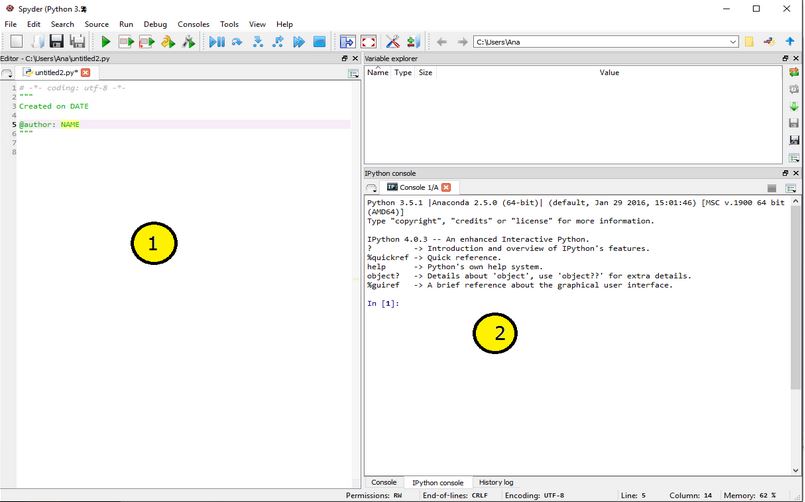
Opening the Spyder application should present you with the above window. This window contains two commonly used parts, among others:
① Code Editor that lets you create and edit existing Python source files.
② IPython interpreter pane, which gives you access to the Python interactive mode.
Now that we are ready with the environment, lets dive into the coding part.
Let’s Start Coding
Working with Data Structures
Pandas is an open source, BSD-licensed library providing high-performance, easy-to-use data structures and data analysis tools for the Python programming language. In order to import Pandas all you have to do is use the following code:
import pandas as pd
Series is a one-dimensional labeled array capable of holding any data type (integers, strings, floating point numbers, Python objects, etc.). The axis labels are collectively referred to as the index. The following code shows us the format to create a series.
s = pd.Series(data, index=index)
DataFrame is a 2-dimensional labeled data structure with columns of potentially different types. You can think of it like a spreadsheet or SQL table, or a dict of Series objects. It is generally the most commonly used pandas object.
Let me illustrate the above concepts with the below code which uses series to build a data frame.
import pandas as pd

data = {'one' : pd.Series([1., 2., 3.], index=['a', 'b', 'c']),
        'two' : pd.Series([1., 2., 3., 4.], index=['a', 'b', 'c', 'd'])}
df1 = pd.DataFrame(data)
df2 = pd.DataFrame(data,index=['b'])

print(df1)
print(df2)
-----<Console Output>-----
   one  two
a  1.0  1.0
b  2.0  2.0
c  3.0  3.0
d  NaN  4.0
   one  two
b  2.0  2.0
One more illustration of creating and printing a Data Frame is as follows:
import pandas as pd

data = [['alexi',10],['bob',15],['cadi',17]]
df1 = pd.DataFrame(data,columns=['Name','Age'])
df2 = pd.DataFrame(data)

print(df1)
print(df2)
-----<Console Output>-----
    Name  Age
0  alexi   10
1    bob   15
2   cadi   17
       0   1
0  alexi  10
1    bob  15
2   cadi  17
Excel/CSV File Interface
In data analysis, since the source data will be in the form of csv or excel file, it is of primordial importance to learn about accessing the data file using python code.
Reading Excel :
Step 1: Import openpyxl or pandas module for reading and writing Excel xlsx/xlsm/xltx/xltm files.
import openpyxl
import pandas
Step 2: Write path of your file. If the file is in your python root folder you don’t have to give path, just write file name and extension. If you saved file as filename.xlsx in source folder on D: drive the path is ; path=”d:/source/filename.xlsx”. Thus, we have essentially recreated our Excel workbook in memory via Pandas.
import pandas as pd

df = pd.read_excel('D:\source\filename.xlsx',sheetname='sheetname')
print(df['Column name']) #prints all the data in a column of sheetname
Writing to Excel :
Here we can see an illustration of pandas library being used to write a data frame to an Excel file. The “engine” parameter is not specified in the ExcelWriter function below. But, the pandas writer.save() function calls the xlsxwriter workbook.close() method which writes all the data to the xlsx file and closes it. Let us keep in mind that pandas writes Excel files using the Xlwt module for xls files and the Openpyxl or XlsxWriter modules for xlsx files.
import pandas as pd

df = pd.DataFrame({'a':[1,3,5,7,4,5,6,4,7,8,9],
'b':[3,5,6,2,4,6,7,8,7,8,9]})
writer = pd.ExcelWriter('Pandas-Example2.xlsx')
df.to_excel(writer,'Sheet1',index=False) #Write the Column 'a','b' data onto Excel
writer.save()                            #Save the data
Common Excel Tasks
Here we’ll learn how to do the very common excel dataframe tasks like vlookup, finding unique values, counting, adding columns etc., in Python, using Pandas.
The below strip of code does the same operation as vlookup: combining two tables, based on a shared column. The two tables here are df1, and df2. The shared column is the ‘Name’ column. The resulting dataframe is stored in the results table.
results = df2.merge(df1,on='Name')

(OR)

results = df2.merge(df1,on='Name',how='inner')
To understand the python merge operation in detail let us go through the different types as follows:
Merge Types
There are three other types of merges excluding the ‘Inner’ type, available in Pandas.
- Inner Merge / Inner join – The default Pandas behaviour, only keep rows where the merge “on” value exists in both the left and right dataframes.
- Left Merge / Left outer join – (aka left merge or left join) Keep every row in the left dataframe. Where there are missing values of the “on” variable in the right dataframe, add empty / NaN values in the result.
- Right Merge / Right outer join – (aka right merge or right join) Keep every row in the right dataframe. Where there are missing values of the “on” variable in the left column, add empty / NaN values in the result.
- Outer Merge / Full outer join – A full outer join returns all the rows from the left dataframe, all the rows from the right dataframe, and matches up rows where possible, with NaNs elsewhere.
The merge type to use is specified using the “how” parameter in the merge command, taking values “left”, “right”, “inner” (default), or “outer”.Venn diagrams are commonly used to exemplify the different merge and join types. See this example from Stack overflow:

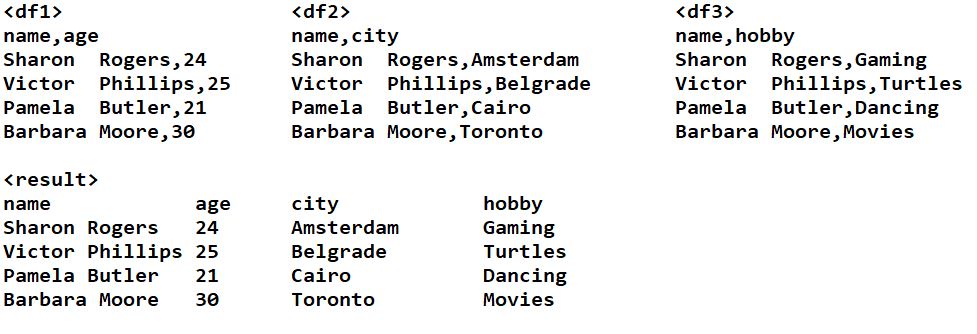
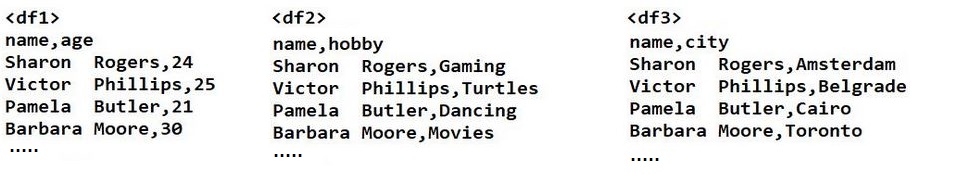
Now that we have gone through the different types of merge operations , let me take you through an illustration of inner merge on multiple data frames. We will read the input data from three csv files, the contents of which are ; name & age columns<df1>, name & city columns<df2>, name & hobby columns<df3>. The resulting work.xlsx or work.csv file will contain four columns ,i.e, name, age, city, hobby and will contain the result of inner merge values . Each of the data frame is displayed below along with the result data frame.
The below program shows us the implementation of the above inner join/merge operation.
#Code to merge three dataframes on a common column name
import pandas as pd

#Three data frames in seperate csv files
df1 = pd.read_csv(r'C:\python\csv\people-ages.csv')
df2 = pd.read_csv(r'C:\python\csv\people-cities.csv')
df3 = pd.read_csv(r'C:\python\csv\people-hobbies.csv')

temp = pd.merge(df1,df2,on='name')    #Perform inner merge on df1 n df2
result = pd.merge(temp,df3,on='name') #Now perfrom inner merge on temp n df3

#write to a new excel file
writer =pd.ExcelWriter('work.xlsx',engine='openpyxl')
result.to_excel(writer, sheet_name='Sheet1',index= False)
writer.save()

#in case of writing to csv
#result.to_csv('work.csv', sep='\t')
In case we want to pull out unique values from a particular column of a data frame, we can use the below code fragment as an addition to the above.
a = result['city'].unique()
print(a)

-----<Console Output>-----
['Amsterdam' 'Belgrade' 'Cairo' 'Toronto']
The below code fragment addition to the above will get all the values of a particular row in a data frame, just by specifying the row number ,i.e, location staring with ‘0’.
b = result.iloc[0]

-----<Console Output>-----
name Sharon Rogers
age 24
city Amsterdam
hobby Gaming
Name: 0, dtype: object
Just an extension to the above code, indexing and displaying a cell value in a data frame or table can be done using row, column parameter.
#Print the value of a particular cell in the above work.xlsx file
import pandas as pd
df = pd.read_excel('work.xlsx', sheetname = 'Sheet1')
print(df.iloc[3,3])

-----<Console Output>-----
Movies
In case we want to concatenate two column data into the third one, we can do so using the following code.
import pandas as pd

df = pd.read_excel('work.xlsx', sheetname = 'Sheet1')
df["3rd column name"] = df["name"] + df["hobby"]
print(df["3rd column name"])
df.head                      #gives out the whole data frame output

-----<Console Output>-----

0 Sharon RogersGaming
1 Victor PhillipsTurtles
2 Pamela ButlerDancing
3 Barbara MooreMovies
Moving forward we can also count the number of occurrences of a particular string in a specified column.
# Counting the occurence of "Turtles" in the column "hobby" of work.xlsx file /the above result dataframe
import pandas as pd
df = pd.read_excel('work.xlsx',sheetname='Sheet1')
print(df[df["hobby"]=="Turtles"].count())

-----<Console Output>-----

name   1
age    1
city   1
hobby  1
dtype:int64
The below code will be useful when we are searching for a sub string in a data frame.
 ---Splitting a column into 2 and searching a substring-----
import pandas as pd
df = pd.read_csv(r'C:\python\csv\people.csv')

df['left'], df['right'] = df['name'].str.split(' ').str   #seperating the column by space in text

print(df[df['left']=="Sharon"].count())                   #search,count n print Sharon name on the left side
print(df[df['right']==" Rogers"].count())                 #search,count n print Rogers name on the right side
print(df['left'])
print(df['right'])

-----<Console Output>-----

name 1
left 1
right 1
dtype: int64

name 1
left 1
right 1
dtype: int64

0 Sharon
1 Victor
2 Pamela
3 Barbara

0 Rogers
1 Phillips
2 Butler
3 Moore
Here we are outputting the required data in a serial form w.r.t the user input. Basically we are converting the data frame column data into a serial form provided the user input data exists in the table.
import pandas as pd

df1 = pd.read_excel('work.xlsx',sheetname='Sheet1') #'work.xlsx' file contains 4 hobbies w.r.t 'Sharon Rogers' in respective column
def steps(pname):                  #take user input name
                                   #Select & index over the 'name' column of df1 dataframe and compare with user input
A = []                             #declare a 1D array variable
 for index in df1.index:           #index over the df1 dataframe (12 rows, 3 columns)
  if df1['name'][index] == pname :
   A.append(df1['hobby'][index])   #Append data to the 1D array 'A'
 print(A)                          #print the data at the end

steps('Sharon Rogers')             #take the user data input

-----<Console Output>-----

['Gaming', 'Drinking beer', 'Turtles', 'Robots design']
Here i am taking you through a program which is used to write to a particular cell of excel sheet using the openpyxl library.
import pandas as pd
import openpyxl                          #Lib required to write to excel
from openpyxl import load_workbook

df1 = pd.read_excel('work.xlsx', sheetname = 'Sheet1')

def steps(pname):
 A = []                                  #Declare a list
 for index in df1.index:
  if df1['name'][index] == pname :
   A.append(df1['name'][index])
 return(A)

arr1 = steps('Sharon Rogers')             #user input

wb = load_workbook('work.xlsx')
ws = wb.active                            #activate the sheet of the file

ws.cell(row=5,column=5).value = str(arr1) #writing to a particular cell. Str conversion as it is array.
wb.save('work.xlsx')                      #save the file

-----<work.xlsx Output>-----
['Sharon Rogers'] @ cell row5/column5
Mini Project
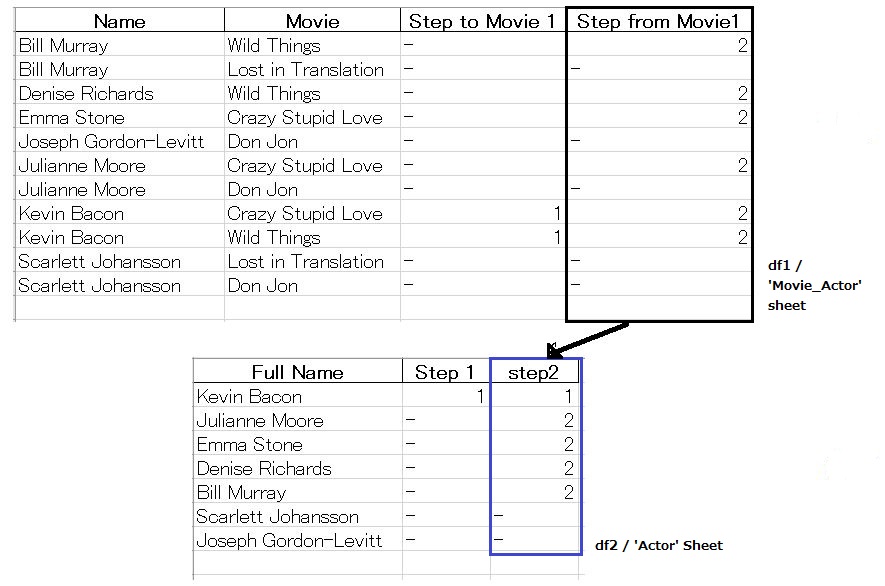
The goal of this project is to calculate an actor’s number taking Kevin Bacon’s number as the reference. Let me define the challenge as follows: Kevin Bacon has number 1 and everyone who has ever played in a movie with Kevin Bacon, like Bill Murray in Wild Things, have Bacon number 2. Everyone who has played in a movie with Bacon number 2 have Bacon number 3 and so on.
Working on multiple sheets data in an excel file
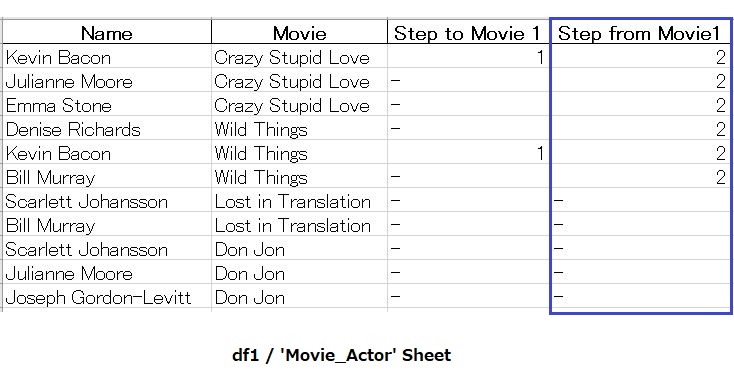
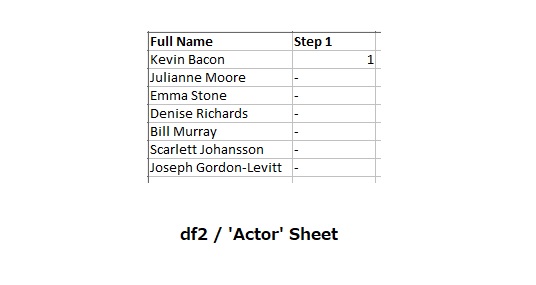
The given source file ,i.e, the excel file ‘assignmentsmallstart.xlsx‘ consists of more than one sheet . The main sheets which we will be associated with are the ‘Movie_Actor’ & ‘Actor’ sheet. In the step 1 , that is calculating the ‘Step to Movie 1’ column data we can use a single vlookup to pull the step 1 value/Bacon value of actors from ‘Actor’ sheet. However as we move on to the subsequent step ,i.e, ‘Step from Movie1’ a single vlookup will not get us the results and we will need more than one vlookup to generate the output which is cumbersome. This is the point from where we will take the advantage of python coding to help us.
Let us divide the challenge into 2 parts: First part to calculate the ‘Step from Movie1’ column data in ‘Movie_Actor’ sheet and second part to calculate the Step 2 column data in ‘Actor’ sheet based on the ‘Step from Movie1’ data of ‘Movie_Actor’ sheet.
Calculating the 'Step from Movie1' column data
Our focus here will be on the ‘Movie_Actor’ sheet only.
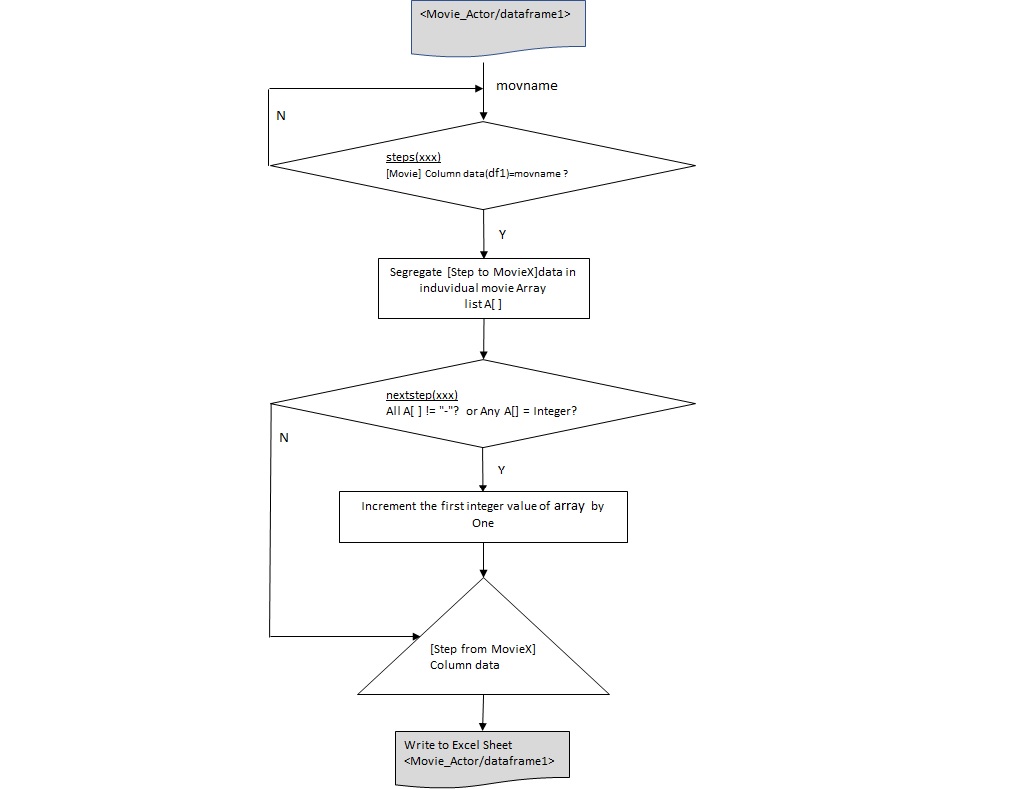
Flowchart & Program:
Refer to the below flow chart to grasp the logic of reading, calculating and writing data to/from the excel file while deriving the column data of ‘Step from Movie1/X’ . This logic is implemented in the python code which follows the below chart.
import pandas as pd
import numpy as np
import openpyxl		#Lib required to write to excel
import os               #Lib to use OS dependent functionality like location etc

df1 = pd.read_excel('assignmentsmallstart.xlsx',sheet_name='Movie_Actor')
df2 = pd.read_excel('assignmentsmallstart.xlsx',sheet_name='Actor')

##function outputs the bacon number list for each movie in ([1,'-','-'],,,,)
def steps(movname):
    A = []                  #declare a 1D array list here*location important*
    for index in df1.index:
        if df1['Movie'][index] == movname :
           A.append(df1['Step to Movie 1'][index])
    return(A)

##function outputs the number of other members in a movie with'Kevin Bacon'
def nextstep(arr1):            #nextstep function
    for item in list(arr1):    #indexing over each item in the arr1 list
        if item != '-':        #Incase item in the list not equal to '-'
            return item + 1    #increment and return the plus one value
    return '-'                 #return "-" in case no ones present

df1['Step from Movie 1'] = ""

#Automatically taking the Movie data to output the ('step from Movie1')
for index, row in df1.iterrows():
   df1['Step from Movie 1'][index] = nextstep(steps(row['Movie']))

#writing the data to excel file using 'openpyxl' library
writer = pd.ExcelWriter("assignmentsmallstart.xlsx", engine='openpyxl')

#Required to keep other sheets in the workbook
if os.path.exists("assignmentsmallstart.xlsx"):
    book = openpyxl.load_workbook("assignmentsmallstart.xlsx")
    writer.book = book

#write to the workbook creates a duplicate sheet
df1.to_excel(writer, sheet_name='Movie_Actor', index = False)
writer.save()

book.get_sheet_names()                      #Delete duplicate original sheet
std = book.get_sheet_by_name('Movie_Actor')
book.remove_sheet(std)

ws = book.get_sheet_by_name('Movie_Actor1') #Rename the duplicate sheet
ws.title = 'Movie_Actor'
writer.close()
Calculating the 'Step2' column data
Here we will be calculating the ‘step2’ column data of ‘Actor’ sheet based on the ‘Step from Movie1’ column data of ‘Movie_Actor’ sheet. So our focus here will be on both the sheets exchanging the data.
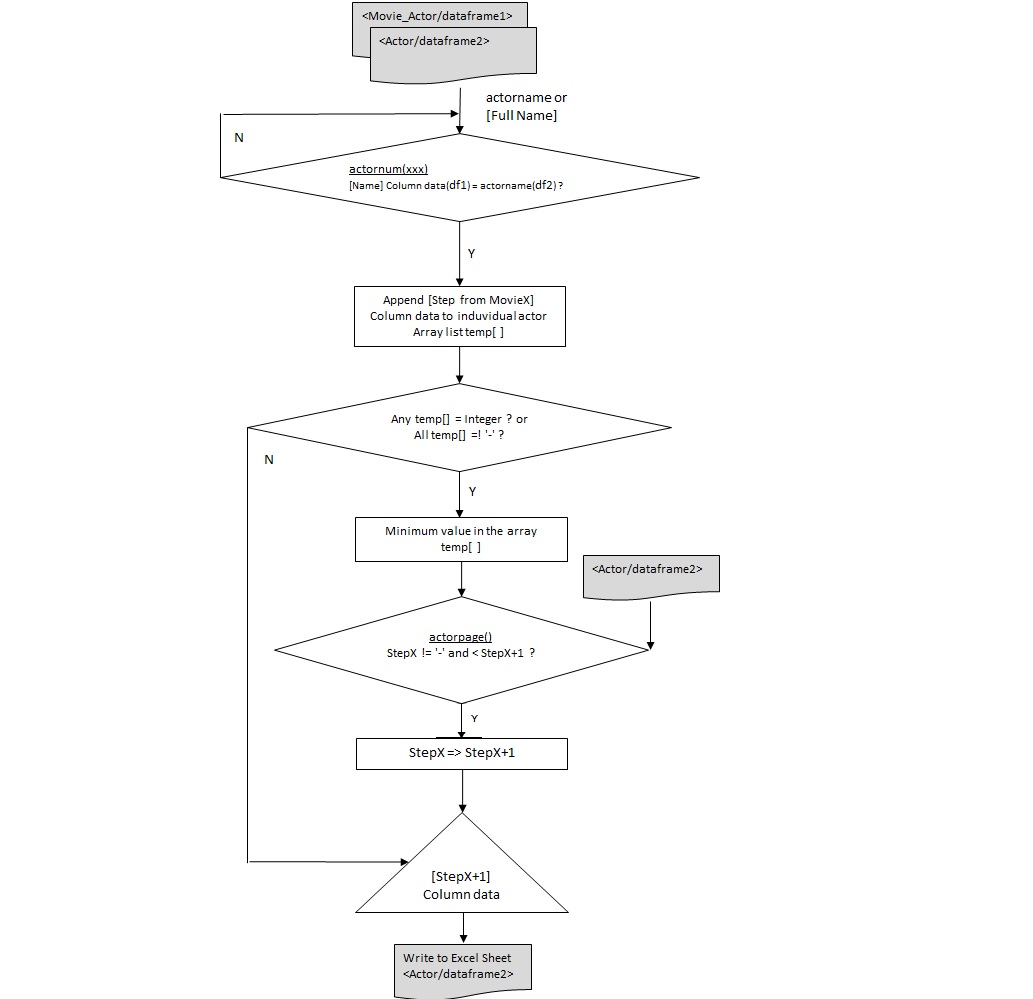
Flowchart & Program:
Refer to the below flow chart to grasp the logic of reading, calculating and writing data to/from the excel file while deriving the column data of ‘Step2/X+1′ . This logic is implemented in the python code which follows the below chart. The code has been written separately considering that we have the above df1 excel data on hand.
#Function which picks unique derived bacon number from the 'Step from Movie1' column
def actornum(actorname):
    temp = []
    for index in df1.index:
        if df1['Name'][index] == actorname: #compare the actor data with name
            temp.append(df1['Step from Movie3'][index]) #append if a match

    if all([a=='-' for a in temp]):              #incase all items are '-' in above list
       return '-'                                #return '-'
    elif any([a=='-' for a in temp]):
       temp = pd.to_numeric(temp,errors='coerce')#convert list to number in case str '-'
       return int(np.nanmin(temp))               #return min num from the list excl nan
    else:                                        #if all are num or a mix of '-' and num
      return min(temp)                           #return min number from the list

#Function gets the unique number from Movie_actor sheet and writes to Actor sheet df
df2['step4'] = ""                                #declare new dataframe column
def actorpage():
    for index in df2.index:
        df2['step4'][index] = actornum(df2['Full Name'][index]) #call actornum()

    for index, row in df2.iterrows():
        if(row['step3']!= '-' and row['step3']<row['step4']): #if prv col is lower val&No '-'
               row['step4'] = row['step3']       #assign  previous column value to the newone

actorpage()                                      #call the actorpage() function

#writing the data to excel file using 'openpyxl' library
writer = pd.ExcelWriter("longmovies.xlsx", engine='openpyxl')

if os.path.exists("longmovies.xlsx"):            #Required to keep other sheets in workbk
    book = openpyxl.load_workbook("longmovies.xlsx")
    writer.book = book

df2.to_excel(writer, sheet_name='Actor', index = False) #creates a duplicate sheet

book.get_sheet_names()                           #Delete the duplicate original sheet
std = book.get_sheet_by_name('Actor')
book.remove_sheet(std)

ws = book.get_sheet_by_name('Actor1')            #Rename the duplicate sheet
ws.title = 'Actor'

writer.save()
writer.close()
Representing graphs (data structure)
Before we start with Python representations of graphs, i would like to look into some general definitions of graphs and its components.
A “graph” in mathematics and computer science consists of “nodes”, also known as “vertices”. Nodes may or may not be connected with one another.The connecting line between two nodes is called an “edge”.If the edges between the nodes are undirected, the graph is called an undirected graph. If an edge is directed from one vertex (node) to another, a graph is called a directed graph.
Though graphs may look very theoretical, many practical problems can be represented by graphs.They are often used to model problems or situations in physics, biology, psychology and above all in computer science. In computer science, graphs are used to represent networks of communication, data organization, computational devices, the flow of computation to name a few.The link structure of websites can be seen as a graph as well, i.e. a directed graph, because a link is a directed edge or an arc.
Creating a Graph
Two of the software libraries which we will be using here are the NetworkX and Matplotlib. NetworkX is used for the creation, manipulation, and study of the structure, dynamics, and functions of complex networks. Matplotlib is a Python 2D plotting library which can generate plots, histograms, power spectra, bar charts, errorcharts, scatterplots, etc., with just a few lines of code. It can be used to produce publication quality figures in a variety of hard copy formats.
We can add one node with the method add_node(). Graph can be created or increased by adding one edge at a time by the method add_edge(), which has the two nodes of the edge as the two parameters. We can add a bunch of edges as a list of edges in the form of 2 tuples. Here we are using the matplotlib library to display the graph in ‘.png’ format.
import networkx as nx
import matplotlib.pyplot as plt

G=nx.Graph()
G.add_node("b")
G.add_nodes_from(["e","f"])
G.add_edge("b","f")

G.add_edges_from([("a","c"),("c","d"), ("a",1), (1,"d"), ("a",2)])

nx.draw(G, with_labels=True)   # create graph with labels
plt.savefig("simple_path.png") # save as png
plt.show()                     # display

Network Graph
Working on a Single data frame
Here were will be plotting the contents of a single data frame which had two columns namely, ‘name’ & ‘city’. Find below the screenshot of the excel file ‘graph1.xslx’.
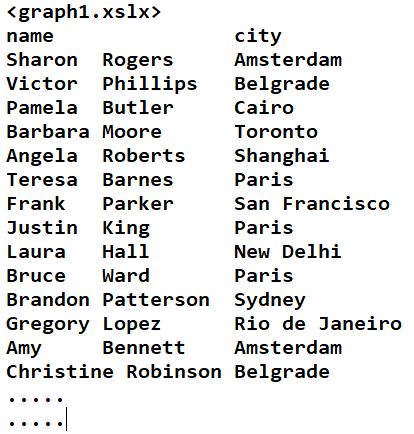
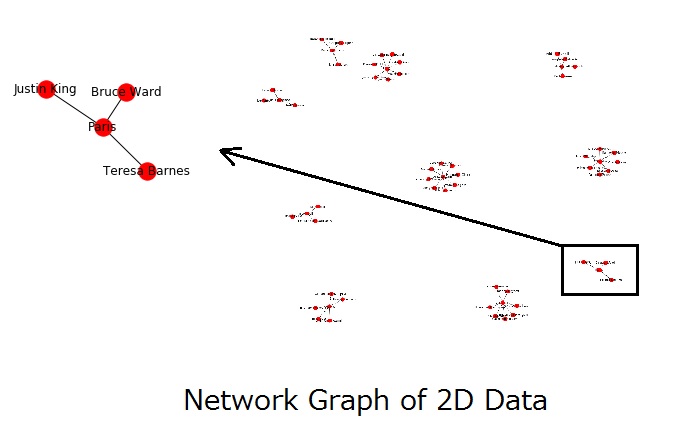
The below python code is used to plot the above dataframe as a network plot. Also the number of nodes and edges are displayed.
# libraries
import pandas as pd
import networkx as nx

import matplotlib.pyplot as plt

#Set the graph display size as 25x25
plt.figure(figsize=(25,25))

df1 = pd.read_excel('graph1.xlsx',sheet_name='People-Cities')

#Build your graph
G=nx.from_pandas_edgelist(df1,'name','city')

# Plot it with labels
nx.draw(G, with_labels=True)

#print the node n edge count
print(G.number_of_nodes())
print(G.number_of_edges())
----------<Console Output>------------

60(nodes), 50(edges)
As we can see , Name & city names are the parameters used to plot the graph.
Working on Multiple data frames
Here we work on different data frames and display the customized data frame as a graph. To obtain the final data frame we perform a merge operation on the input files ,i.e, the CSV files ‘graphage.csv’, ‘graphhob.csv’, ‘graphcity.csv’.
The Python implementation on multiple data frames is as follows:
# libraries
import pandas as pd
import networkx as nx

import matplotlib.pyplot as plt

#Set the graph display size as 25x25
plt.figure(figsize=(25,25))

df1 = pd.read_csv(r'C:\python\csv\graphage.csv')
df2 = pd.read_csv(r'C:\python\csv\graphhob.csv')
df3 = pd.read_csv(r'C:\python\csv\graphcity.csv')

temp = pd.merge(df1,df2,on='name')
result = pd.merge(temp,df3,on='name')

#Build your graph
G=nx.from_pandas_edgelist(result,'hobby','city')

# Plot it with labels
nx.draw(G, with_labels=True)
We can see that city & hobby names which are present in different data frames/files and are the parameters used to plot this graph after merging the three data frames.

Credits:
Online certification on Data Analysis
Q&A on diverse python topics (www.stackoverflow.com/)
Python Excel Interface(www.pythontutor.net/openpyxl.php)
Python Merge Operations(www.shanelynn.ie/merge-join-dataframes-python-pandas-index-1/)
Python Network Graph Plot(qiita.com/inoory/items/088f719f2fd9a2ea4ee5)
Python Graphs(www.python-course.eu/)


Leave a Reply