A good dashboard is simple and avoids information overload. It features clear formatting, descriptive titles, and is dynamic, easy to maintain, and straightforward to update. Before creating a dashboard, several factors must be considered, the most important being the needs of the target audience. Understanding these requirements helps determine what information should be displayed. It is also a good practice to validate the dashboard content with key stakeholders in advance to ensure alignment and relevance.
The dashboard that we will create will include a chart, Text display area, table, and a slicer that controls the entire dashboard display based on the selected month. The final dashboard as shown below will have dependency on multiple sheets. The details of the sheets in the visualization is as follows:
- Main Dashboard / Report Sheet
- Pivot etc Sheet
- Data Sheet (May-Aug)
- Text display table Sheet (Notes)
Main Dashboard / Report Sheet
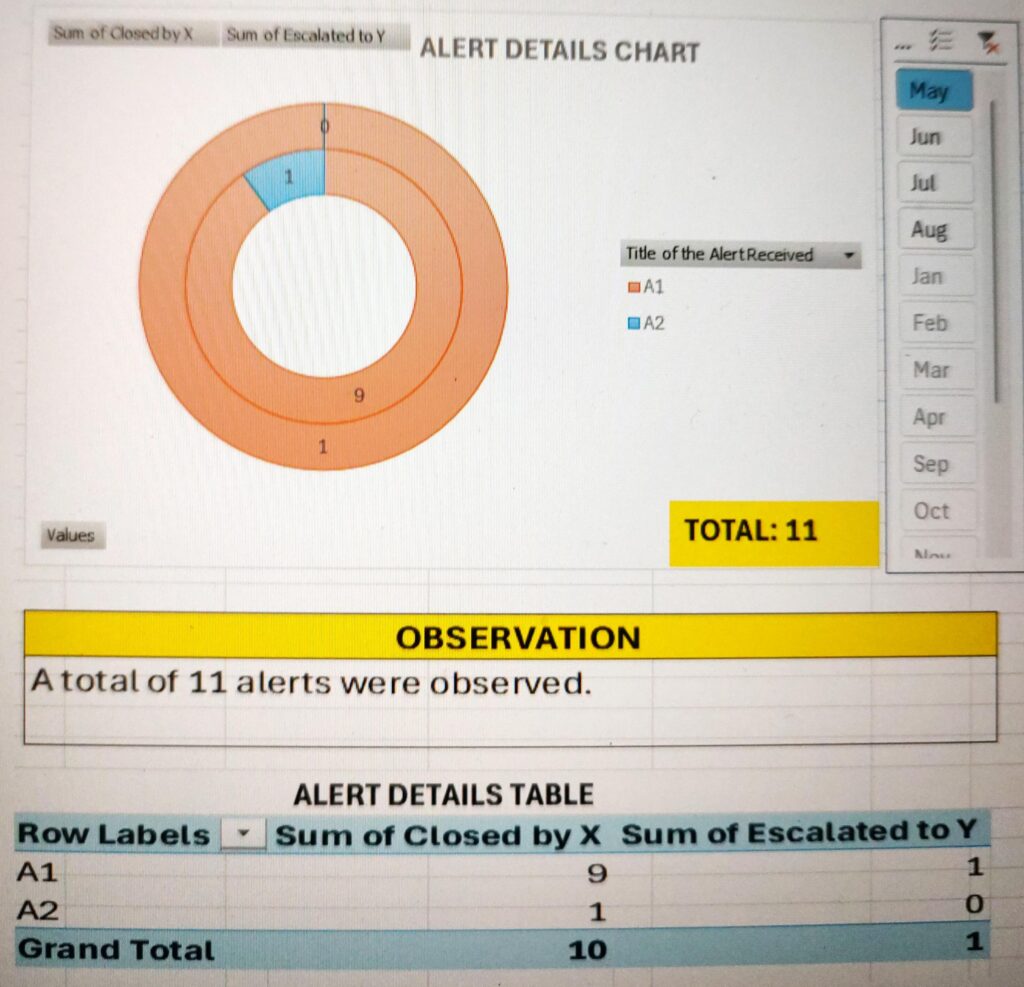
Following is the final dashboard that we will create. The upper Doughnut chart consists of the alert details along with the Total Count of alerts. The total alert count(highlighted) is calculated using the formula as shown below, wherein the ‘pivot etc‘ refers to a separate sheet that you can find in the subsequent sections. This formula needs to be entered in the function entry area (fx) and not in the highlighted text box. The Chart section is followed by an observation section that contains the analysis of the chart. The lower most section is the Alert table that provides the alert details in a Table format.
TOTAL = 'pivot etc'!$E$13
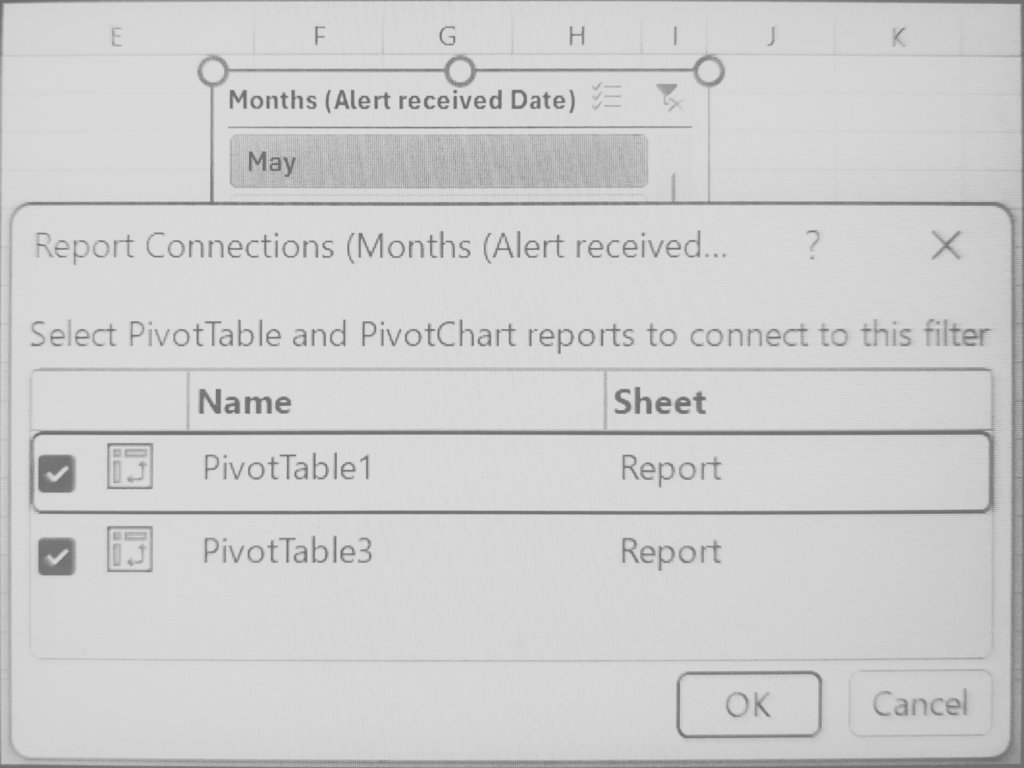
The slicer section is on the upper right of the dashboard. This slicer when stretched will appear as follows. The slicer is mainly used to select the months separately (or make multiple selections at once). You can connect the slicer to multiple PivotTables by using the Report Connections feature, which can be selected by right-clicking the slicer. Tick the check boxes to synchronise the two Pivot charts simultaneously with any active Slicer selections.
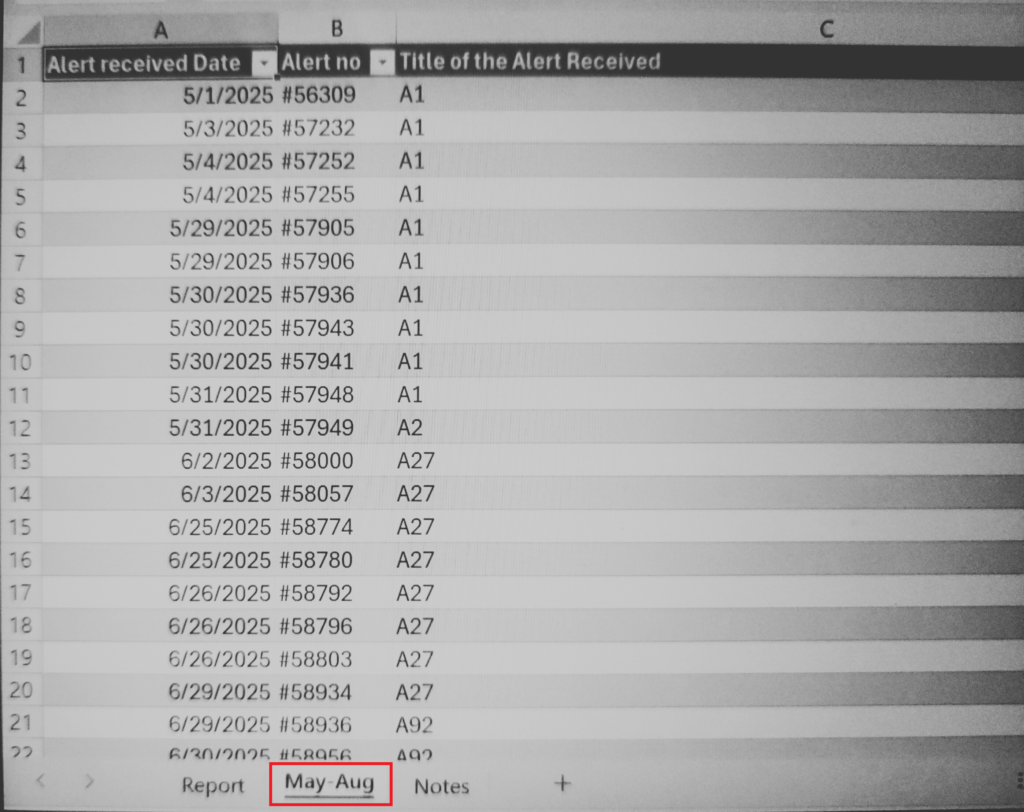
‘May-Aug’ Alert list Sheet
Append the data to the list that needs to be analysed. This also includes the columns – Closed by X and Escalated to Y that are not visible in the image below.
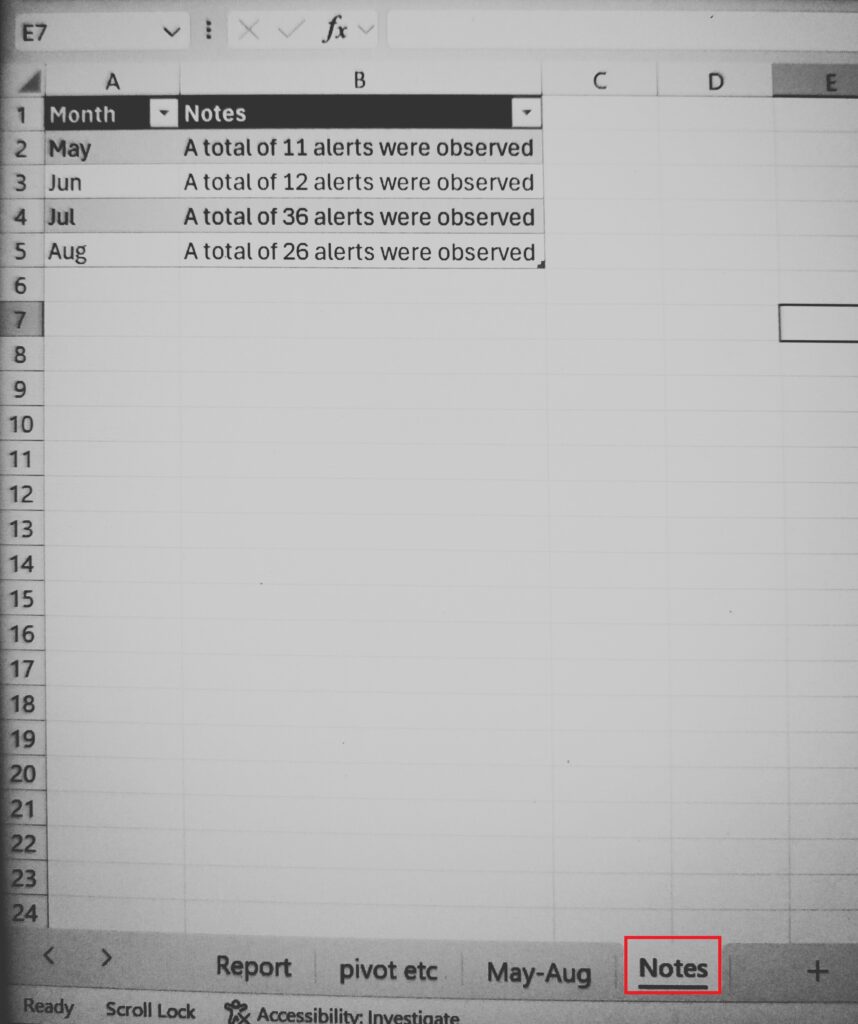
Notes Sheet
This sheet consists of the table (Table1) in which the observations are entered each month.
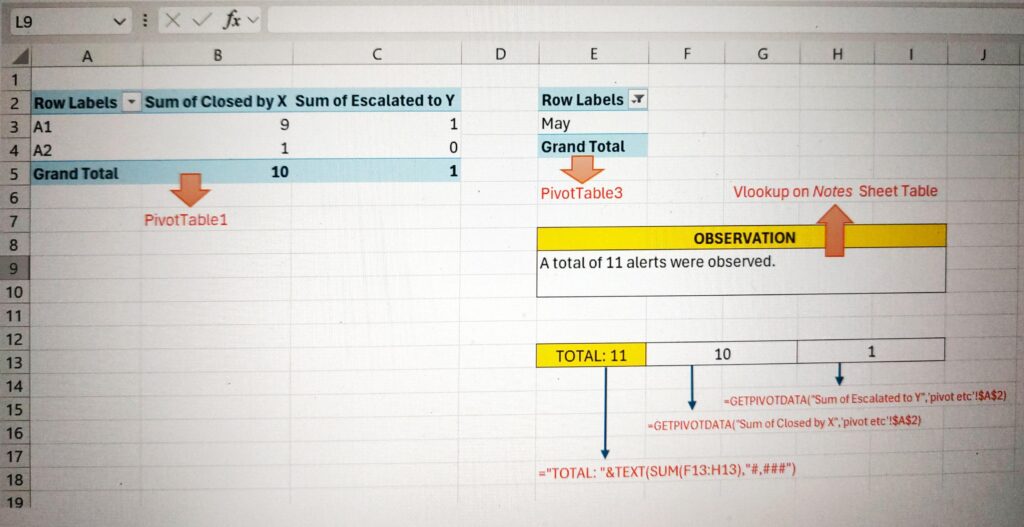
‘Pivot etc’ Sheet
In the “Pivot etc” sheet, we have all the Pivot charts, Vlookup and other functions that is necessary to create the above dashboard. “PivotTable1” can be used as it is in the main dashboard lower section or it can be copied and pasted as a Linked Picture in the main dashboard. The Linked Picture updates automatically as and when the pivot table data changes. The “PivotTable3” is mainly used by the Observation section to read the month information and gather the corresponding month Notes column data from the Notes sheet table using Vlookup function as shown below. Remember to properly do the cell alignment settings so that the text is properly displayed at the upper left end of the observation area.
Vlookup('pivot etc'!E3,Table1,2,0)
The TOTAL section is the summation of the two column values from the Grand Total row of the PivotTable1. You can find the formula used in the corresponding cells as follows. (The same formulae can be found in the image below as well. The formulae is displayed using the FORMULATEXT function.)
G13 = Getpivotdata("Sum of Closed by X", 'pivot etc'!$A$2)
H13 = Getpivotdata("sum of Escalated to Y", 'pivot etc'!$A$2)
E13 = "TOTAL: "&text(sum(G13:H13),"#,###")
Updating the dashboard for each month is easy. Enter your observations for the month on the Notes sheet table in a new row. This needs to be followed by appending the new month alert data to the “May-Aug” alert list sheet. Finally, right-click on the slicer on Main dashboard/Report Sheet to select the Refresh option, which will update the dashboard display automatically.
Further Reading:


Leave a Reply