Openpyxl is a Python library to read/write Excel xlsx/xlsm/xltx/xltm files. This can be particularly helpful in data analysis wherein, user might have to go through thousands of rows and pick out few handful information to make small changes based on some criteria. Using Openpyxl module, these tasks can be done very efficiently and easily.
Since python is the language being used, one needs to have the python installer downloaded and installed as mentioned in one my earlier blogs. The next step is to install the library ‘openpyxl’ using the following command in the command prompt.
C:\Users\foldername>pip install openpyxl
Depending upon whether the library is already installed or is a new install, appropriate message will be displayed. Once this is done, just type in the following command to verify the proper install.
C:\Users\foldername>py
Python 3.6.2 (v3.6.2:5fd33b5, Jul 8 2017, 04:14:34) [MSC v.1900 32 bit (Intel)] on win32
Type "help", "copyright", "credits" or "license" for more information.
>>>import openpyxl
>>>
The above status verifies that the openpyxl library is properly installed and can be imported to be used in the python programs. The final requirement would be to install the MS Excel program since we are mainly using python programs to work with excel data. Openoffice can be used as well in place of MS Excel.
IDLE is the Python environment(Editor & Shell) we will be using. You can open IDLE directly from your Python script file. Right click the file, then choose “Edit with IDLE”. You can run your python script by going to “Run –> Run Module” or simply by hitting F5. The script will then run in the IDLE shell window. Since you now have a saved script, you can run it again and again.
Description
Workbooks, Sheets and Cells
In our first python script below, we will look into the basic excel operations performed on a file like opening an existing workbook, creating/copying/appending/deleting a sheet in the workbook, doing the ‘save as’ on workbooks etc. Please refer to the below code wherein the comments have been added at appropriate places describing the actions they perform. Also the section of code has been commented out just to execute it part by part.
from openpyxl import Workbook        # Module needed for creating new workbook
from openpyxl import load_workbook   # Module needed for loading existing workbook
from copy import copy                # Module needed for copying sheet

wb=Workbook()
filename = "test workbook.xlsx"

wb = load_workbook(filename)         #open existing workbook
sheet = wb.active
sheet['A1']=1                        #Absolute cell referencing
sheet.cell(row=2,column=2).value=2   #Relative cell referencing

##sheet1=wb.create_sheet("sheet1")   #create and append a new sheet at the end,
##sheetx=wb.create_sheet("sheetx",0) #desired position

##wb.remove(wb["sheetx"])            #delete a sheet,
##del wb["sheet1"]                   #alternate way of deleting sheet

##sheet.title = "sampath"            #assign a new name/title to a sheet

##print(sheet.title)                 #print the sheet name/title

##source = wb["sampath"]             #copy and create a new sheet "sheetcpy"
##new_sheet = wb.copy_worksheet(source)
##new_sheet.title = "sheetcpy"

##worksheets = wb.sheetnames         #indexing & printing all sheet names
##print(worksheets)

##wb.save("new workbk.xlsx")         #save the workbook with a new name

wb.save(filename)                    # save the above data
In our next python script below, we move into working on cells. Here we are mainly focusing on assigning value to a cell, creating cell range, looping/iterating over multiple rows/columns, appending row values, inserting/deleting row/s at the desired location, inserting/deleting column/s at the desired location, moving a cell/range of cells to a desired location, copying a cell value to the desired location etc. Comments have been added in the code at appropriate places for better understanding.
from openpyxl import Workbook                   # Module needed for creating new workbook
from openpyxl import load_workbook              # Module needed for loading existing workbook

from openpyxl.utils.cell import get_column_letter       # Module to get column letter
from openpyxl.utils.cell import column_index_from_string# Module to get column index#

wb=Workbook()
filename = "testbook.xlsx"

wb = load_workbook(filename)
sheet = wb.active

##sheet[get_column_letter(5)+"2"].value = "abc"         #using get column letter on cell
##print(sheet["E2"].value)

##cell_range = sheet['A1':'B2']                         #create cell range with absolute ref
##cell_range = sheet[get_column_letter(1)+"1":get_column_letter(2)+"2"]  #relative ref
##for a, b in cell_range:
##    print(a.value, b.value)
##print()

##print(column_index_from_string("A"))                  #using get column index

##sheet["A1"].value = "sampath"                         #using offset on cell
##sheet.cell(1,1).offset(0,1).value = "kumar"
##sheet["A1"].offset(0,2).value = "ananda"
##print(sheet["A1"].value,sheet["B1"].value,sheet["C1"].value)

##for i in range(1, 4):                                 #loop over row/col and print coordinates
##    for j in range(1, 4):
##        cell = sheet.cell(row=i, column=j)
##        print(cell.coordinate, end=" ")
##    print()

##for row in sheet.iter_rows(max_row=5, max_col=5):     #iterate using iter_rows
##        for cell in row:
##            print(cell.coordinate, end=" ")
##        print()

##for column in sheet.iter_cols(max_col=5, max_row=5):  #iterate using iter_cols
##        for cell in column:
##            print(cell.coordinate, end=" ")
##        print()

##sheet.append( ["abc", 123, 456] )                     #append row values

##sheet.insert_rows(0)                                  #insert row at the desired loc
##sheet.delete_rows(1)                                  #delete row/s from desired loc>0
##sheet.delete_rows(2,3)

##sheet.insert_cols(0)                                  #insert col at the desired loc
##sheet.delete_cols(1)                                  #insert col/s at the desired loc
##sheet.delete_cols(1,3)

##sheet.move_range("A1:B2",rows=5,cols=0)               #moving range of cells
##sheet._move_cell(7,1,25,0)                            #moving a cell

##oldcell = sheet.cell(1,5)                             #copy a cell value
##newcell = sheet.cell(10,10,oldcell.value)
##newcell = sheet.cell(25,oldcell.col_idx,oldcell.value)

wb.save(filename)                                       #save the above data
In our final script in this section, we will be dealing with mainly the cell formatting operations like, cell border/colour/number formatting, cell format copy, merge/unmerge cells, cell/sheet protection, creating a workbook with fixed number of sheets.
from openpyxl import Workbook                   # Module needed for creating new workbook
from openpyxl import load_workbook              # Module needed for loading existing workbook

from openpyxl.styles.borders import Border, Side, BORDER_THIN, BORDER_THICK, BORDER_DASHDOT, BORDER_DOUBLE
                                                         #border format

from openpyxl.styles import colors, Font                 # Module needed for colour formatting
from openpyxl.styles.fills import PatternFill

from openpyxl.styles.numbers import FORMAT_PERCENTAGE_00 # Module needed for number formatting

from openpyxl.styles.protection import Protection        # Module needed for cell/sheet protection

from copy import copy                                    # Module needed for copy operation

wb=Workbook()
filename = "testcellfmt.xlsx"

wb = load_workbook(filename)
sheet = wb.active

##border_cell = sheet.cell(row=3, column=4)
##new_cell = sheet.cell(row=5, column=2)
##                                                              #cell border format
##borders = Border(left=Side(border_style=BORDER_THIN, color='00000000'),\
##                 right=Side(border_style=BORDER_THICK, color='00000000'),\
##                 top=Side(border_style=BORDER_DASHDOT, color='00000000'),\
##                 bottom=Side(border_style=BORDER_DOUBLE, color='00000000'))
##border_cell.border = borders
##
##red_color = colors.Color(rgb='00FF0000')                      #cell colour fill
##solid_red_fill = PatternFill(patternType='solid', fgColor=red_color)
##border_cell.fill = solid_red_fill

##border_cell.number_format = FORMAT_PERCENTAGE_00              #cell number - format to %age

##new_cell.border = copy(border_cell.border)                    #cell format copy
##new_cell.fill = copy(border_cell.fill)

##sheet.merge_cells('A1:B1')                                    #merge/unmerge cells
##sheet.unmerge_cells('A1:B1')
##sheet.merge_cells(start_row=3, start_column=1, end_row=3, end_column=3)

##sheet.protection.sheet = True                                 #sheet protection
##sheet.protection.password = '123'
##sheet.protection.enable()

##sheet.cell(row=1,column=1).protection = Protection(locked=False, hidden=False)  #unlock a cell in the sheet

##wb2 = Workbook()                                              #creation of workbook with fixed # of sheets
##wb2.security.workbookPassword = '123'
##wb2.security.lockStructure = True
##wb2.save("Cell formatting2.xlsx")

wb.save(filename)                                               #save the above data
Formulas, Tables and Other formatting
Moving forward into the topic of formula and table in the below strip of code, we are creating a table with three columns and five rows with values assigned to each cell as part of the code. The sum of the values in the first column is calculated using the SUM formula and the result is assigned to the first column in the seventh row.
from openpyxl import Workbook                 # Module needed for creating new workbook
from openpyxl import load_workbook            # Module needed for loading existing workbook

from openpyxl.worksheet.table import Table, TableStyleInfo # Module needed for Table operations

wb=Workbook()
filename = "testbooktable.xlsx"

wb = load_workbook(filename)
sheet = wb.active
                                                                     #TABLE creation
sheet.append(["QtyA","QtyB","QtyC"])                                 #Heading must be string
cell_range = sheet['A2':'C6']
for a, b, c in cell_range:
    a.value =5
    b.value =2
    c.value =5
table_name = Table(displayName="tablename", ref="A1:C6")
style = TableStyleInfo(name="TableStyleMedium8", showRowStripes=True)#Add a default style
table_name.tableStyleInfo = style
sheet.add_table(table_name)                                          #Add table to the sheet

first_cell = sheet.cell(2,1)                                         #SUM formula
last_cell = sheet.cell(6,1)
sheet.cell(7,1).value = "=sum(" +str(first_cell.coordinate) +":" +str(last_cell.coordinate) +")"

wb.save(filename)                                                    #save the above data
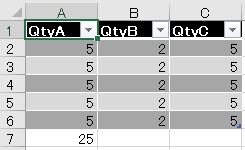
Table & Formula Excel Output
Here we can see the actual output of the above code in Excel file. We can observe that all the cells have been assigned values and the SUM of the first column is appropriately placed in the seventh row of the first column.
Next i would like to move onto the other formatting options available in excel and how do we realize the same in python code. The formatting options that we will be looking into are Auto filter, Freeze row/column, Grouping/Ungrouping of rows/columns, print page setup. In the code i have also shown how to open an excel file directly after executing the code. Please refer to the comments in the below code for details.
from openpyxl import Workbook                 # Module needed for creating new workbook
from openpyxl import load_workbook            # Module needed for loading existing workbook

from openpyxl.worksheet.page import PrintPageSetup  # Module needed for print pagesetup

import os                                     # Module needed to open excel file after code run

wb=Workbook()
filename = "testexcelf.xlsx"

wb = load_workbook(filename)
sheet = wb.active

sheet["A1"].value = "Month"                                    #offset on cell to assign headr
sheet.cell(1,1).offset(0,1).value = "Serial"
sheet.auto_filter.ref = "A1:B15"                               #auto filter/manually click OK
sheet.auto_filter.add_filter_column(0, ["Jan", "Feb", "Mar"])
sheet.auto_filter.add_sort_condition("B2:B15", descending=True)#auto filter/man. click option
##sheet.freeze_panes = "A2"                                    #freeze row1
##sheet.freeze_panes = "A1"                                    #unfreeze "A1"/None
##sheet.freeze_panes = "B1"                                    #freeze column1

##sheet.column_dimensions.group('A','D')                       #column grouping A to D
##sheet.column_dimensions.group('A','D', outline_level =2)     #Level 2 grouping
##sheet.column_dimensions.group('C','D', outline_level =1)     #Level 1 group within Level 2
##sheet.row_dimensions.group(1,10)                             #row grouping 1 to 10 rows
                                                               #*ungrouping tbd manually*

                                                               #print page setup
##sheet.page_setup = PrintPageSetup(worksheet=None, orientation='portrait', paperSize=sheet.PAPERSIZE_LETTER,\
##      scale=None, fitToHeight=None, fitToWidth=None, firstPageNumber=None,\
##      useFirstPageNumber=None, paperHeight=None, paperWidth=None, pageOrder=None,\
##      usePrinterDefaults=None, blackAndWhite=None, draft=None, cellComments=None,\
##      errors=None, horizontalDpi=None, verticalDpi=None, copies=None, id=None)

os.system("start EXCEL.EXE " + filename)                       #opening the excel sheet

wb.save(filename)                                              #save the above data
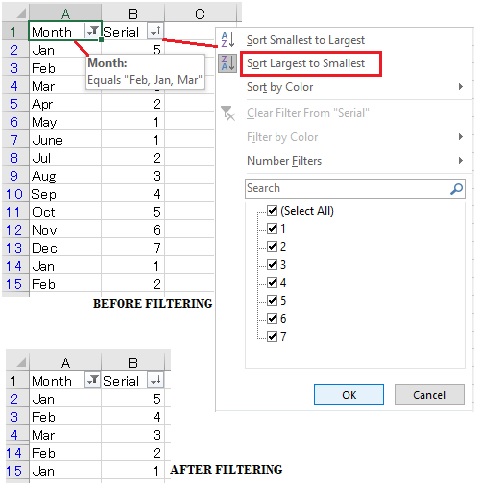
Auto Filter
The Auto filter option in the above code would give the above figure output in excel. However only the header has been added through code and the other data has been input manually. As we can see here, the filter options get selected through code, but unless we click on the OK button for the first column option and the sort.. option in the second column we will not get the result. Refer to the figure to get a clear picture of before and after filtering.
Charts
In the final section, we will be working on charts and chart sheets. However, Matplotlib is the most used library for plotting in python.
from openpyxl import Workbook                      # Module needed for creating new workbook
from openpyxl import load_workbook                 # Module needed for loading existing workbook

from openpyxl.chart import BarChart, ScatterChart, PieChart, Reference, AreaChart, Series

wb=Workbook()
filename = "testcharts.xlsx"

wb = load_workbook(filename)
sheet = wb.active

series1 = Reference(sheet, min_col=1, min_row=1, max_col=1, max_row=10)
series2 = Reference(sheet, min_col=2, min_row=1, max_col=2, max_row=10)

bar_chart = BarChart()                                                #barchart
bar_chart.add_data(series1, titles_from_data=True)
bar_chart.add_data(series2, titles_from_data=True)
bar_chart.title = "Bar Chart"
bar_chart.style = 11
bar_chart.x_axis.title = 'Size'
bar_chart.y_axis.title = 'Percentage'
sheet.add_chart(bar_chart, "A16")

##cs = wb.create_chartsheet()                                         #chartsheet
##
##chart = AreaChart()
##chart.title = "Area Chart"
##chart.style = 13
##chart.x_axis.title = 'machida'
##chart.y_axis.title = 'odawara'
##data = Reference(sheet, min_col=12, min_row=1, max_row=10)
##categories = Reference(sheet, min_col=11, min_row=1, max_row=10)
##chart.add_data(data, titles_from_data=False)
##chart.set_categories(categories)
##
##cs.add_chart(chart)


wb.save(filename)                                                      #save the above data
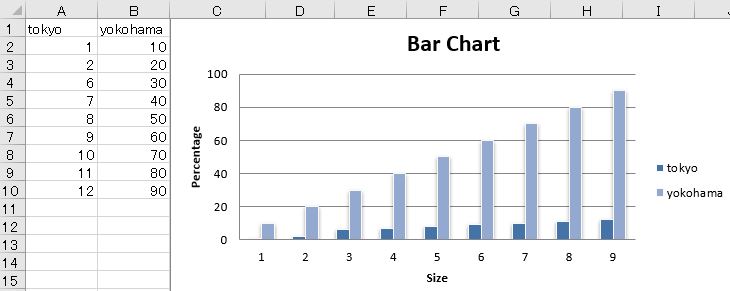
In the above code, we read the data present in ten rows, two columns and represented the same in bar chart as shown in the below figure. Also in the commented out section we are making use of the chart sheet facility available so that we can display the chart in a separate sheet.
Credits:
Self study (www.udemy.com)
openpyxl.readthedocs.io


Leave a Reply