
Optimizing your scrum process in Jira involves leveraging some of the key areas like the custom dashboard to increase visibility, automation rules to reduce manual overload and refined board filters for focused work. To measure the team performance metrics like resolution time, Issue statistics and sprint performance the pie chart gadget can be used. Combine the Pie chart with the other inbuilt charts like burndown chart, velocity chart etc to get a better understanding of how the sprint is progressing. In one of my previous blogs on automation, I had introduced about the various helpful automation rules to optimize your scrum project. For better board management, you have something called quick filters and board filters. Quick filters are dynamic, clickable filters that the scrum team members can toggle on/off to narrow down the board view, while the Board filter is your foundational JQL query that defines which issues appear on your scrum board.
In this blog, we will delve into the advanced level of each key area mentioned above that can help you elevate your Scrum process.
Board Filter Refinement
If we have multiple boards in a project, tasks and stories from one board can appear in another board’s backlog if proper board filters are not set. Additionally, to create a board that only displays work items you want included, you can use filters based on a JQL query.
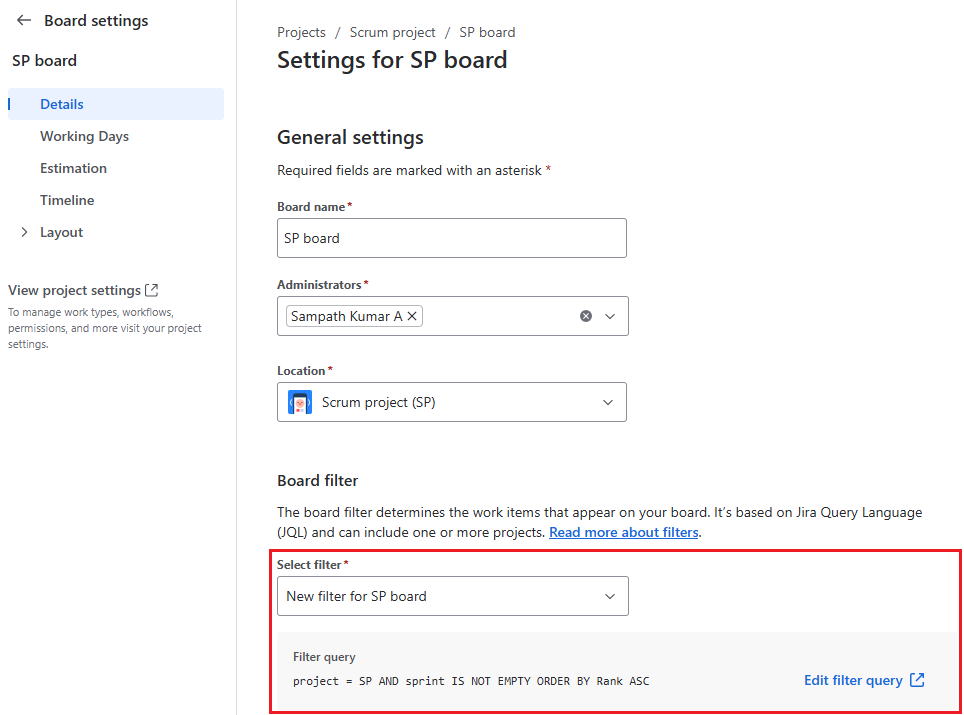
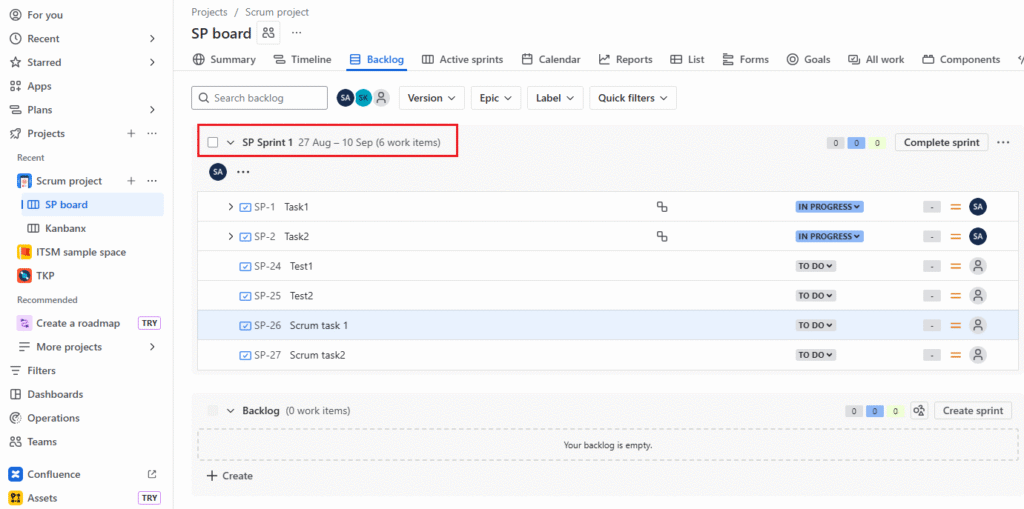
In the above Scrum board setting, the filter query is set to display only the work items that has the sprint section with some value. Since the board filter is set as above, you can view only the work items within the SP Sprint 1 backlog as the sprint section in each work item is set to SP Sprint 1.
In the same project, you have one more board called Kanbanx ,i.e., Scrum project (SP). The kanban board filter query is set to filter only work items with the labels section set to test.
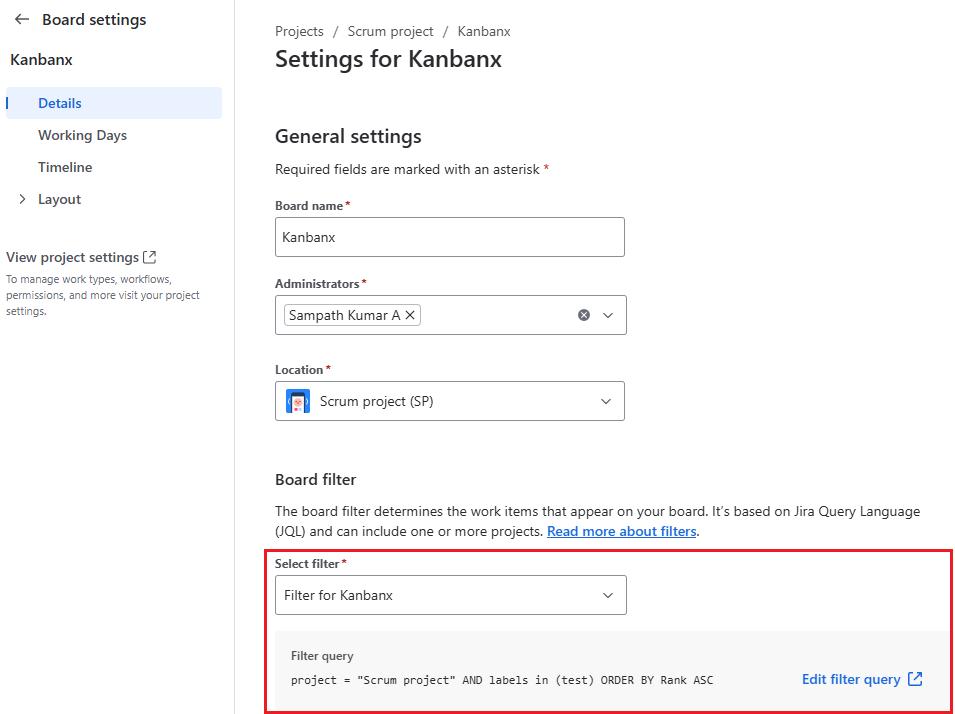
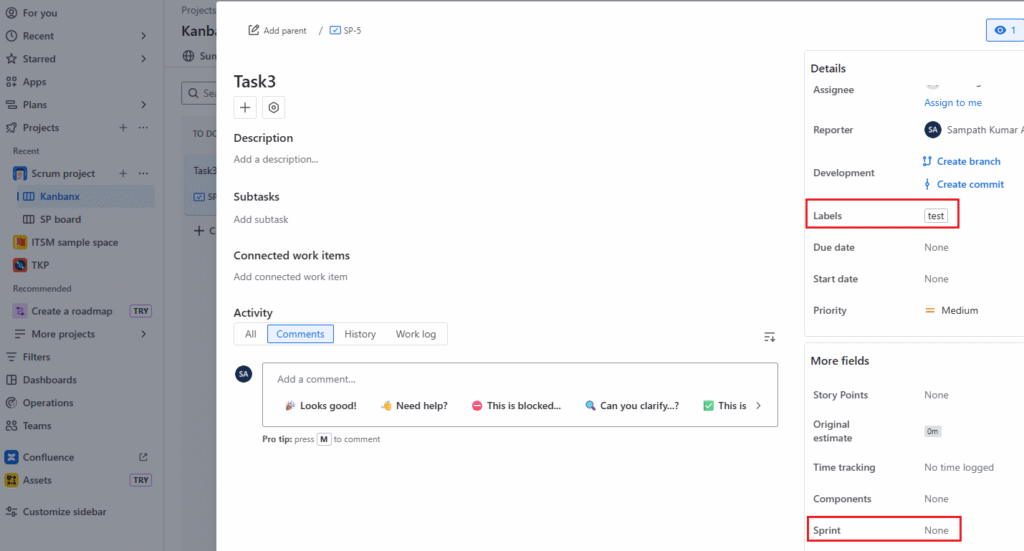
As you can see in the screenshot below, on the kanban board we can get to see only the work item/s set to the value of test with the sprint section empty.
Advanced Automation Rules
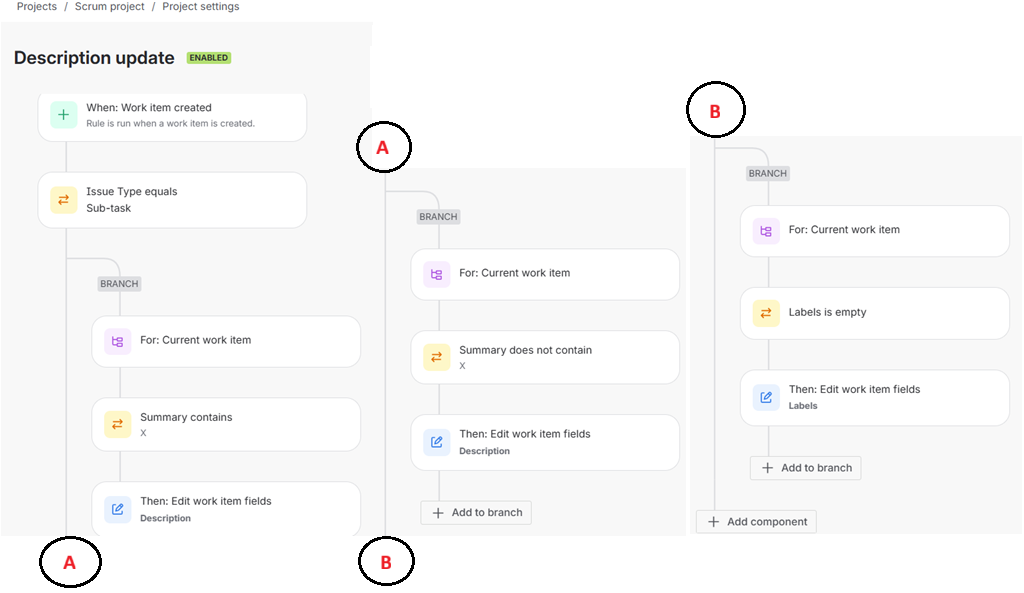
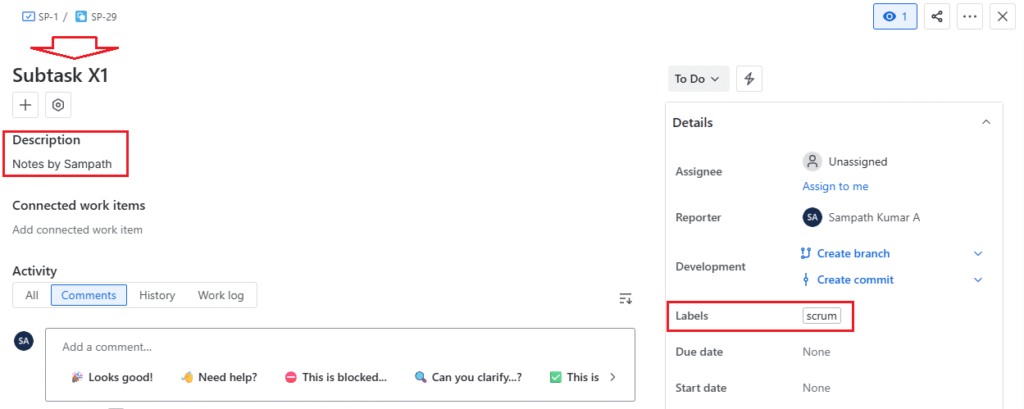
The picture below depicts the branching rule in Jira automation. For any newly created subtask in the project, if the summary contains the letter X, the description field of the work item will be edited to include the text “Notes by Sampath”. The same is depicted in the next picture below.
In the below picture, you can see the subtask with X in the summary part.
However, if the description section does not contain the letter X, then the description will be edited to include the text “General notes:” as shown below.
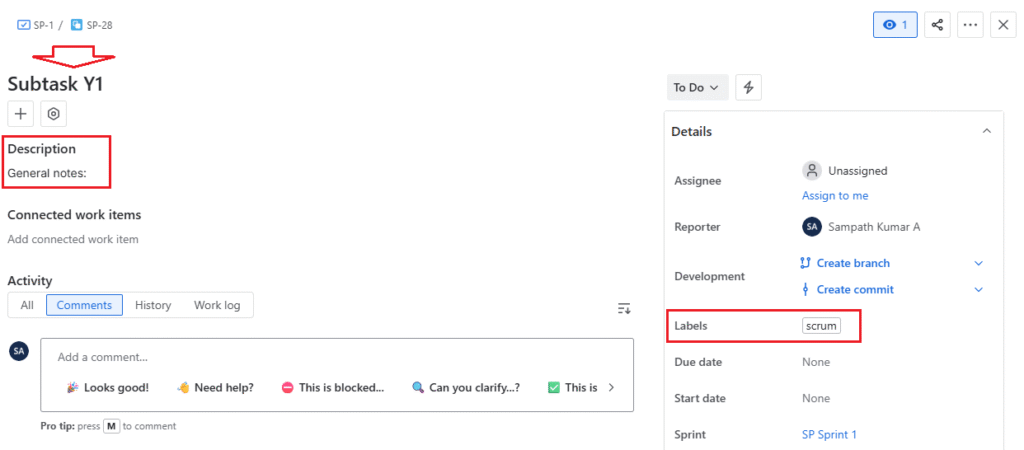
The last branch rule in the above description update is about adding the Labels as scrum to any subtask that has empty labels.
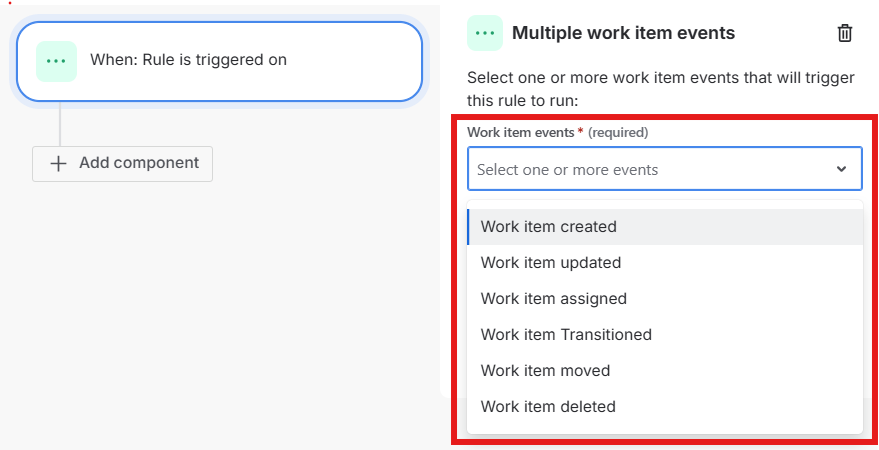
Another helpful feature in Jira automation is the Multiple work item events. Using this feature, you can trigger the workflow at multiple events of work item without using branches, that can be really helpful in some cases.
Custom Dashboard
In this section on the dashboard, i will introduce you to the usage of a Workload Pie Chart to display the per-person effort of a scrum team. This is an inbuilt Jira feature. Let us say the sprint starts on 3rd and ends on the 16th of September. The JQL filter that we need to create would be as follows. Remember to make the appropriate settings under Filter details so that the data is visible to the concerned person or group.

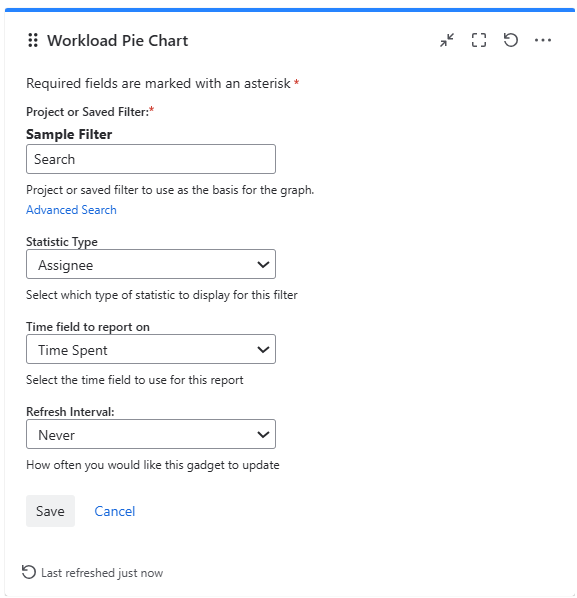
From the gadget section under Dashboards, select the Workload Pie Chart gadget. You can configure the gadget as follows by selecting the above filter, Statistic Type needs to be set to Assignee, Time field to report on needs to be set to Time Spent. Select the refresh interval appropriately and click on save.
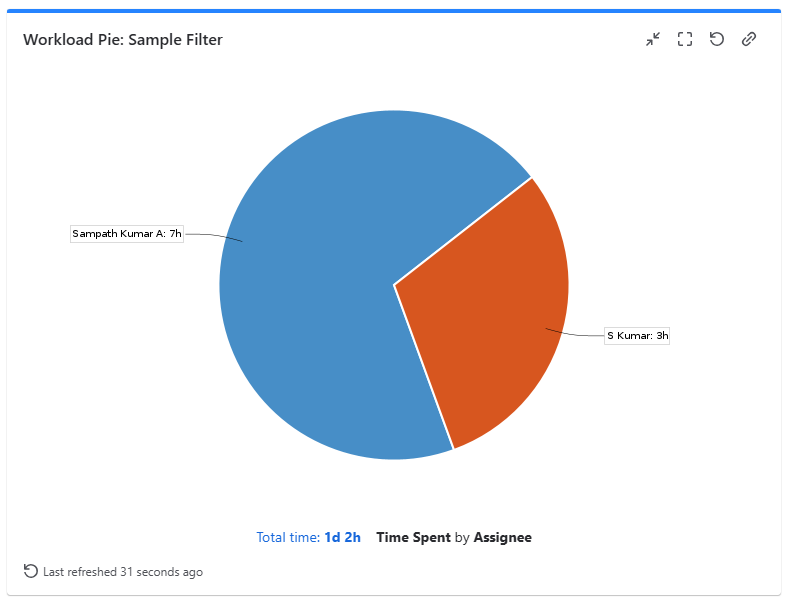
Once you click on the Save button, you will be able to see the following pie chart. Two users have logged the hours in the sprint and hence the respective hours is getting displayed. If more members of the team login in the hours on their subtasks, their efforts will also be displayed.
Further Reading:


Leave a Reply